Paraguayan vs Immigrants from West Indies 10th Grade
COMPARE
Paraguayan
Immigrants from West Indies
10th Grade
10th Grade Comparison
Paraguayans
Immigrants from West Indies
93.7%
10TH GRADE
45.3/ 100
METRIC RATING
179th/ 347
METRIC RANK
91.8%
10TH GRADE
0.0/ 100
METRIC RATING
291st/ 347
METRIC RANK
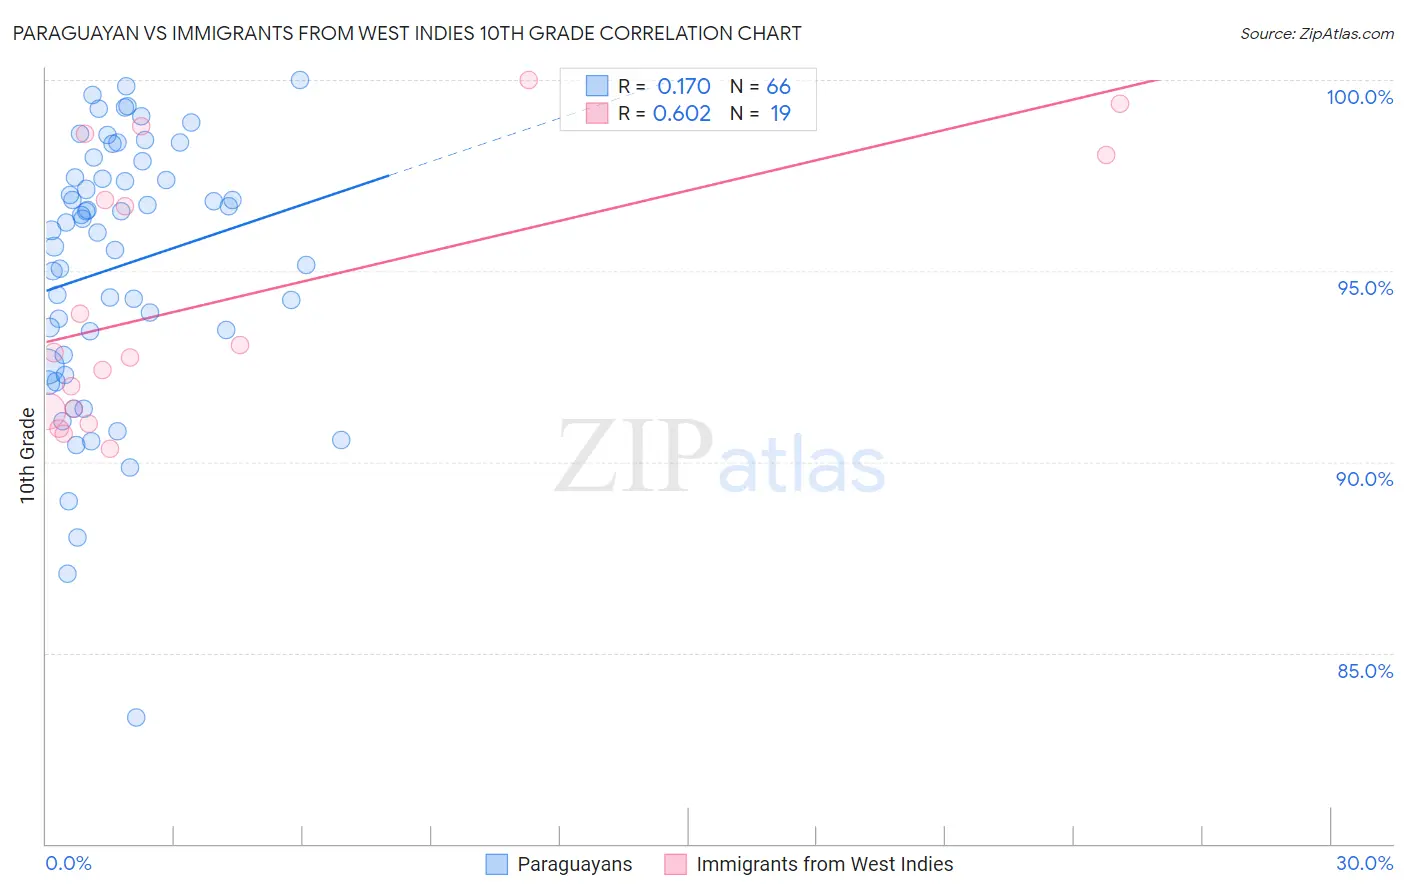
Paraguayan vs Immigrants from West Indies 10th Grade Correlation Chart
The statistical analysis conducted on geographies consisting of 95,114,201 people shows a poor positive correlation between the proportion of Paraguayans and percentage of population with at least 10th grade education in the United States with a correlation coefficient (R) of 0.170 and weighted average of 93.7%. Similarly, the statistical analysis conducted on geographies consisting of 72,457,514 people shows a significant positive correlation between the proportion of Immigrants from West Indies and percentage of population with at least 10th grade education in the United States with a correlation coefficient (R) of 0.602 and weighted average of 91.8%, a difference of 2.0%.
10th Grade Correlation Summary
| Measurement | Paraguayan | Immigrants from West Indies |
| Minimum | 83.3% | 90.4% |
| Maximum | 100.0% | 100.0% |
| Range | 16.7% | 9.6% |
| Mean | 95.1% | 94.3% |
| Median | 96.2% | 92.8% |
| Interquartile 25% (IQ1) | 92.8% | 91.3% |
| Interquartile 75% (IQ3) | 97.4% | 98.0% |
| Interquartile Range (IQR) | 4.7% | 6.7% |
| Standard Deviation (Sample) | 3.5% | 3.4% |
| Standard Deviation (Population) | 3.4% | 3.3% |
Similar Demographics by 10th Grade
Demographics Similar to Paraguayans by 10th Grade
In terms of 10th grade, the demographic groups most similar to Paraguayans are Sierra Leonean (93.7%, a difference of 0.010%), Immigrants from Argentina (93.7%, a difference of 0.020%), Immigrants from Lebanon (93.7%, a difference of 0.020%), Blackfeet (93.7%, a difference of 0.020%), and Immigrants from Northern Africa (93.7%, a difference of 0.030%).
| Demographics | Rating | Rank | 10th Grade |
| French American Indians | 50.9 /100 | #172 | Average 93.7% |
| Spaniards | 50.3 /100 | #173 | Average 93.7% |
| Argentineans | 50.0 /100 | #174 | Average 93.7% |
| Immigrants | Nepal | 49.6 /100 | #175 | Average 93.7% |
| Immigrants | Argentina | 47.1 /100 | #176 | Average 93.7% |
| Immigrants | Lebanon | 47.1 /100 | #177 | Average 93.7% |
| Sierra Leoneans | 46.1 /100 | #178 | Average 93.7% |
| Paraguayans | 45.3 /100 | #179 | Average 93.7% |
| Blackfeet | 42.8 /100 | #180 | Average 93.7% |
| Immigrants | Northern Africa | 41.6 /100 | #181 | Average 93.7% |
| Colville | 38.8 /100 | #182 | Fair 93.6% |
| Guamanians/Chamorros | 37.1 /100 | #183 | Fair 93.6% |
| Choctaw | 36.6 /100 | #184 | Fair 93.6% |
| Sudanese | 36.6 /100 | #185 | Fair 93.6% |
| Immigrants | Eastern Asia | 35.1 /100 | #186 | Fair 93.6% |
Demographics Similar to Immigrants from West Indies by 10th Grade
In terms of 10th grade, the demographic groups most similar to Immigrants from West Indies are British West Indian (91.8%, a difference of 0.0%), Immigrants from Burma/Myanmar (91.8%, a difference of 0.0%), Indonesian (91.8%, a difference of 0.020%), Sri Lankan (91.8%, a difference of 0.030%), and Pennsylvania German (91.9%, a difference of 0.060%).
| Demographics | Rating | Rank | 10th Grade |
| Immigrants | Barbados | 0.0 /100 | #284 | Tragic 92.1% |
| Immigrants | South Eastern Asia | 0.0 /100 | #285 | Tragic 92.1% |
| Yuman | 0.0 /100 | #286 | Tragic 92.0% |
| Pennsylvania Germans | 0.0 /100 | #287 | Tragic 91.9% |
| Immigrants | Laos | 0.0 /100 | #288 | Tragic 91.9% |
| Sri Lankans | 0.0 /100 | #289 | Tragic 91.8% |
| British West Indians | 0.0 /100 | #290 | Tragic 91.8% |
| Immigrants | West Indies | 0.0 /100 | #291 | Tragic 91.8% |
| Immigrants | Burma/Myanmar | 0.0 /100 | #292 | Tragic 91.8% |
| Indonesians | 0.0 /100 | #293 | Tragic 91.8% |
| Haitians | 0.0 /100 | #294 | Tragic 91.8% |
| Lumbee | 0.0 /100 | #295 | Tragic 91.7% |
| Immigrants | Grenada | 0.0 /100 | #296 | Tragic 91.6% |
| Fijians | 0.0 /100 | #297 | Tragic 91.5% |
| Cubans | 0.0 /100 | #298 | Tragic 91.5% |