Spanish American vs English Master's Degree
COMPARE
Spanish American
English
Master's Degree
Master's Degree Comparison
Spanish Americans
English
13.0%
MASTER'S DEGREE
1.9/ 100
METRIC RATING
242nd/ 347
METRIC RANK
14.8%
MASTER'S DEGREE
45.0/ 100
METRIC RATING
178th/ 347
METRIC RANK
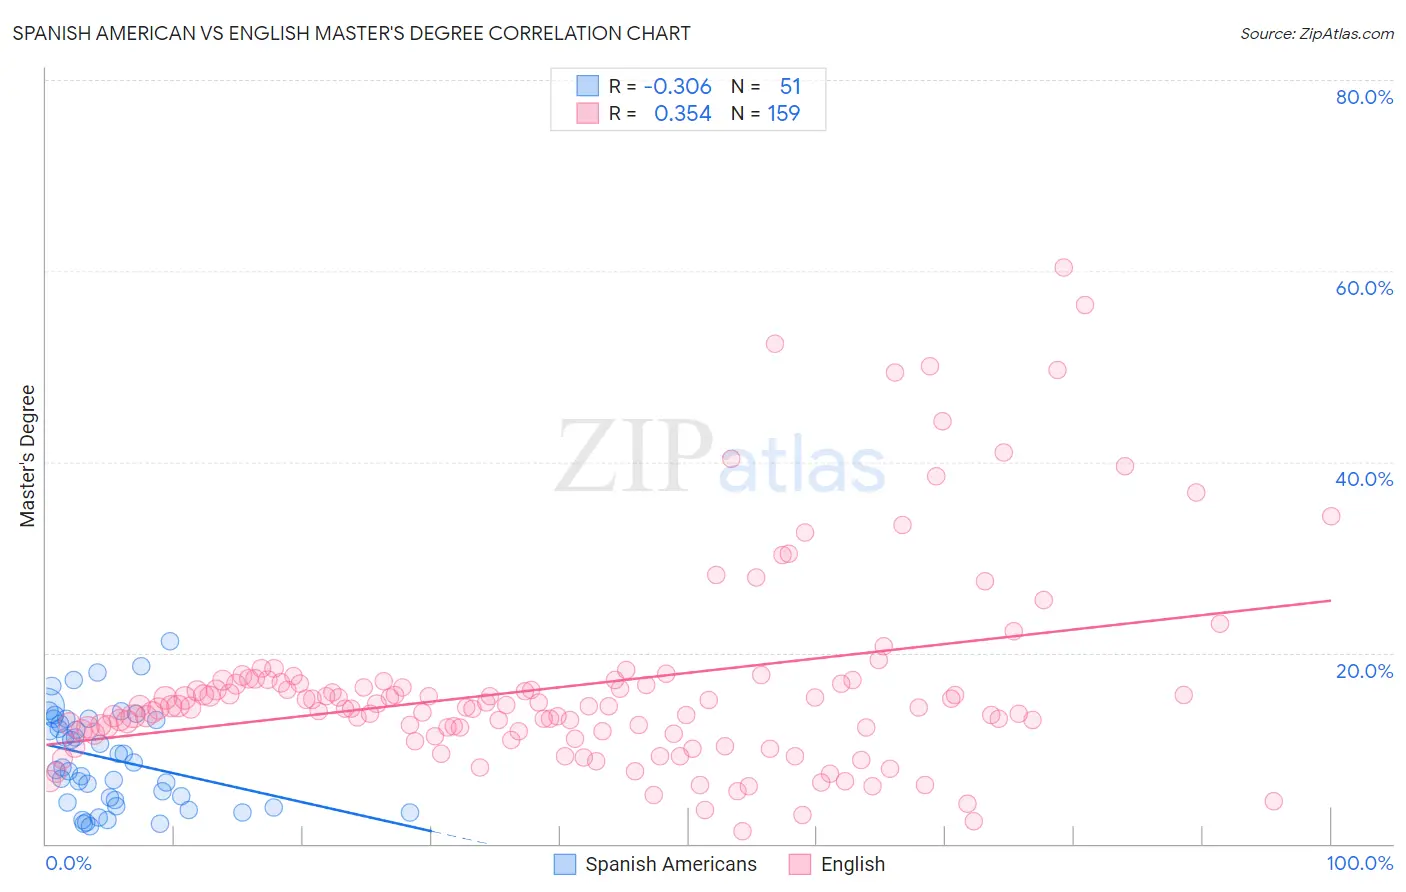
Spanish American vs English Master's Degree Correlation Chart
The statistical analysis conducted on geographies consisting of 103,160,270 people shows a mild negative correlation between the proportion of Spanish Americans and percentage of population with at least master's degree education in the United States with a correlation coefficient (R) of -0.306 and weighted average of 13.0%. Similarly, the statistical analysis conducted on geographies consisting of 578,433,745 people shows a mild positive correlation between the proportion of English and percentage of population with at least master's degree education in the United States with a correlation coefficient (R) of 0.354 and weighted average of 14.8%, a difference of 13.7%.
Master's Degree Correlation Summary
| Measurement | Spanish American | English |
| Minimum | 1.8% | 1.3% |
| Maximum | 21.2% | 60.3% |
| Range | 19.4% | 59.0% |
| Mean | 8.9% | 16.5% |
| Median | 8.0% | 14.4% |
| Interquartile 25% (IQ1) | 4.3% | 11.7% |
| Interquartile 75% (IQ3) | 13.1% | 16.8% |
| Interquartile Range (IQR) | 8.8% | 5.1% |
| Standard Deviation (Sample) | 5.0% | 10.4% |
| Standard Deviation (Population) | 5.0% | 10.4% |
Similar Demographics by Master's Degree
Demographics Similar to Spanish Americans by Master's Degree
In terms of master's degree, the demographic groups most similar to Spanish Americans are Immigrants from Jamaica (13.0%, a difference of 0.040%), U.S. Virgin Islander (13.1%, a difference of 0.28%), Delaware (13.0%, a difference of 0.42%), Guamanian/Chamorro (13.1%, a difference of 0.43%), and Immigrants from Bahamas (12.9%, a difference of 1.1%).
| Demographics | Rating | Rank | Master's Degree |
| German Russians | 4.5 /100 | #235 | Tragic 13.5% |
| Immigrants | Guyana | 4.4 /100 | #236 | Tragic 13.4% |
| Jamaicans | 4.1 /100 | #237 | Tragic 13.4% |
| Hmong | 4.0 /100 | #238 | Tragic 13.4% |
| Immigrants | Nonimmigrants | 3.4 /100 | #239 | Tragic 13.3% |
| Guamanians/Chamorros | 2.2 /100 | #240 | Tragic 13.1% |
| U.S. Virgin Islanders | 2.1 /100 | #241 | Tragic 13.1% |
| Spanish Americans | 1.9 /100 | #242 | Tragic 13.0% |
| Immigrants | Jamaica | 1.9 /100 | #243 | Tragic 13.0% |
| Delaware | 1.7 /100 | #244 | Tragic 13.0% |
| Immigrants | Bahamas | 1.4 /100 | #245 | Tragic 12.9% |
| Immigrants | Cambodia | 1.4 /100 | #246 | Tragic 12.9% |
| Iroquois | 1.4 /100 | #247 | Tragic 12.9% |
| Africans | 1.4 /100 | #248 | Tragic 12.9% |
| Cree | 1.3 /100 | #249 | Tragic 12.8% |
Demographics Similar to English by Master's Degree
In terms of master's degree, the demographic groups most similar to English are Immigrants from Colombia (14.9%, a difference of 0.44%), Nigerian (14.9%, a difference of 0.47%), Immigrants from Iraq (14.8%, a difference of 0.48%), Celtic (14.8%, a difference of 0.49%), and Swiss (14.7%, a difference of 0.51%).
| Demographics | Rating | Rank | Master's Degree |
| Immigrants | Ghana | 53.6 /100 | #171 | Average 15.0% |
| Immigrants | Uruguay | 52.8 /100 | #172 | Average 15.0% |
| Costa Ricans | 52.5 /100 | #173 | Average 15.0% |
| Slovaks | 50.0 /100 | #174 | Average 14.9% |
| Immigrants | Peru | 49.6 /100 | #175 | Average 14.9% |
| Nigerians | 48.6 /100 | #176 | Average 14.9% |
| Immigrants | Colombia | 48.3 /100 | #177 | Average 14.9% |
| English | 45.0 /100 | #178 | Average 14.8% |
| Immigrants | Iraq | 41.3 /100 | #179 | Average 14.8% |
| Celtics | 41.3 /100 | #180 | Average 14.8% |
| Swiss | 41.1 /100 | #181 | Average 14.7% |
| Czechs | 40.4 /100 | #182 | Average 14.7% |
| Sri Lankans | 39.6 /100 | #183 | Fair 14.7% |
| Immigrants | Zaire | 39.5 /100 | #184 | Fair 14.7% |
| Barbadians | 38.3 /100 | #185 | Fair 14.7% |