Spanish American vs Immigrants from Western Europe GED/Equivalency
COMPARE
Spanish American
Immigrants from Western Europe
GED/Equivalency
GED/Equivalency Comparison
Spanish Americans
Immigrants from Western Europe
83.6%
GED/EQUIVALENCY
0.8/ 100
METRIC RATING
251st/ 347
METRIC RANK
87.3%
GED/EQUIVALENCY
97.3/ 100
METRIC RATING
97th/ 347
METRIC RANK
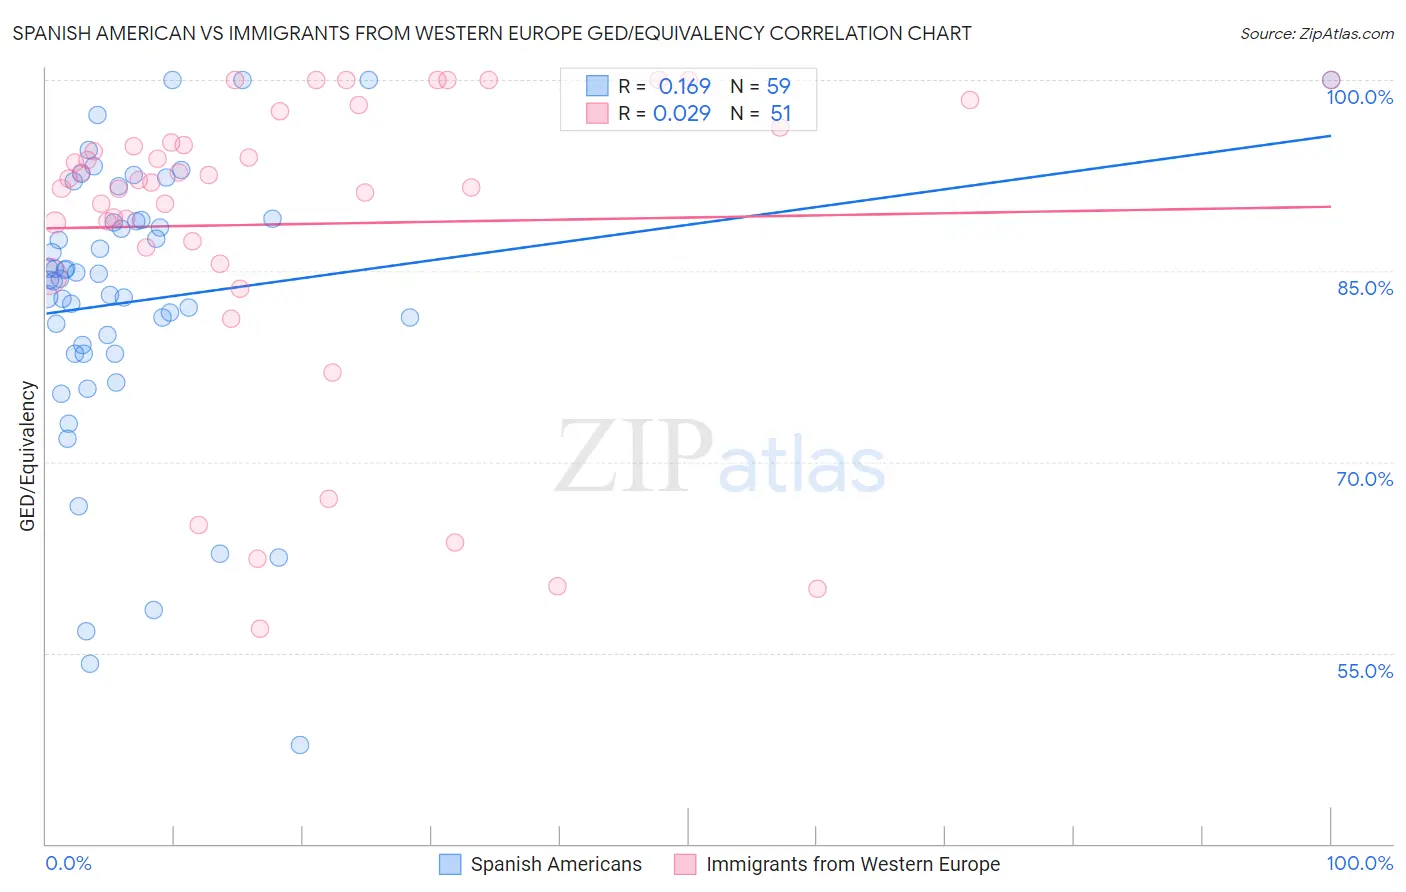
Spanish American vs Immigrants from Western Europe GED/Equivalency Correlation Chart
The statistical analysis conducted on geographies consisting of 103,168,542 people shows a poor positive correlation between the proportion of Spanish Americans and percentage of population with at least ged/equivalency education in the United States with a correlation coefficient (R) of 0.169 and weighted average of 83.6%. Similarly, the statistical analysis conducted on geographies consisting of 494,080,521 people shows no correlation between the proportion of Immigrants from Western Europe and percentage of population with at least ged/equivalency education in the United States with a correlation coefficient (R) of 0.029 and weighted average of 87.3%, a difference of 4.4%.
GED/Equivalency Correlation Summary
| Measurement | Spanish American | Immigrants from Western Europe |
| Minimum | 47.7% | 56.9% |
| Maximum | 100.0% | 100.0% |
| Range | 52.3% | 43.1% |
| Mean | 82.7% | 88.7% |
| Median | 84.3% | 92.2% |
| Interquartile 25% (IQ1) | 78.5% | 86.8% |
| Interquartile 75% (IQ3) | 89.0% | 96.2% |
| Interquartile Range (IQR) | 10.5% | 9.4% |
| Standard Deviation (Sample) | 11.3% | 11.9% |
| Standard Deviation (Population) | 11.2% | 11.8% |
Similar Demographics by GED/Equivalency
Demographics Similar to Spanish Americans by GED/Equivalency
In terms of ged/equivalency, the demographic groups most similar to Spanish Americans are Bahamian (83.6%, a difference of 0.0%), Comanche (83.6%, a difference of 0.060%), Creek (83.6%, a difference of 0.090%), Shoshone (83.7%, a difference of 0.15%), and Crow (83.8%, a difference of 0.16%).
| Demographics | Rating | Rank | GED/Equivalency |
| Immigrants | Ghana | 1.3 /100 | #244 | Tragic 83.9% |
| Immigrants | Senegal | 1.2 /100 | #245 | Tragic 83.8% |
| Chickasaw | 1.2 /100 | #246 | Tragic 83.8% |
| Immigrants | Western Africa | 1.1 /100 | #247 | Tragic 83.8% |
| Blackfeet | 1.1 /100 | #248 | Tragic 83.8% |
| Crow | 1.1 /100 | #249 | Tragic 83.8% |
| Shoshone | 1.0 /100 | #250 | Tragic 83.7% |
| Spanish Americans | 0.8 /100 | #251 | Tragic 83.6% |
| Bahamians | 0.8 /100 | #252 | Tragic 83.6% |
| Comanche | 0.7 /100 | #253 | Tragic 83.6% |
| Creek | 0.7 /100 | #254 | Tragic 83.6% |
| Colville | 0.5 /100 | #255 | Tragic 83.4% |
| Africans | 0.5 /100 | #256 | Tragic 83.4% |
| Jamaicans | 0.4 /100 | #257 | Tragic 83.3% |
| Malaysians | 0.4 /100 | #258 | Tragic 83.3% |
Demographics Similar to Immigrants from Western Europe by GED/Equivalency
In terms of ged/equivalency, the demographic groups most similar to Immigrants from Western Europe are Czechoslovakian (87.4%, a difference of 0.070%), Immigrants from Croatia (87.3%, a difference of 0.070%), Immigrants from Belarus (87.3%, a difference of 0.070%), Immigrants from Greece (87.4%, a difference of 0.090%), and Palestinian (87.3%, a difference of 0.090%).
| Demographics | Rating | Rank | GED/Equivalency |
| Welsh | 97.9 /100 | #90 | Exceptional 87.4% |
| Immigrants | Eastern Asia | 97.9 /100 | #91 | Exceptional 87.4% |
| Israelis | 97.8 /100 | #92 | Exceptional 87.4% |
| Immigrants | North Macedonia | 97.8 /100 | #93 | Exceptional 87.4% |
| Immigrants | Russia | 97.8 /100 | #94 | Exceptional 87.4% |
| Immigrants | Greece | 97.7 /100 | #95 | Exceptional 87.4% |
| Czechoslovakians | 97.6 /100 | #96 | Exceptional 87.4% |
| Immigrants | Western Europe | 97.3 /100 | #97 | Exceptional 87.3% |
| Immigrants | Croatia | 96.9 /100 | #98 | Exceptional 87.3% |
| Immigrants | Belarus | 96.9 /100 | #99 | Exceptional 87.3% |
| Palestinians | 96.8 /100 | #100 | Exceptional 87.3% |
| Syrians | 96.6 /100 | #101 | Exceptional 87.2% |
| Lebanese | 96.2 /100 | #102 | Exceptional 87.2% |
| Jordanians | 96.1 /100 | #103 | Exceptional 87.2% |
| Immigrants | Hungary | 96.0 /100 | #104 | Exceptional 87.2% |