Spanish American vs Assyrian/Chaldean/Syriac In Labor Force | Age 35-44
COMPARE
Spanish American
Assyrian/Chaldean/Syriac
In Labor Force | Age 35-44
In Labor Force | Age 35-44 Comparison
Spanish Americans
Assyrians/Chaldeans/Syriacs
82.8%
IN LABOR FORCE | AGE 35-44
0.0/ 100
METRIC RATING
293rd/ 347
METRIC RANK
84.0%
IN LABOR FORCE | AGE 35-44
6.6/ 100
METRIC RATING
222nd/ 347
METRIC RANK
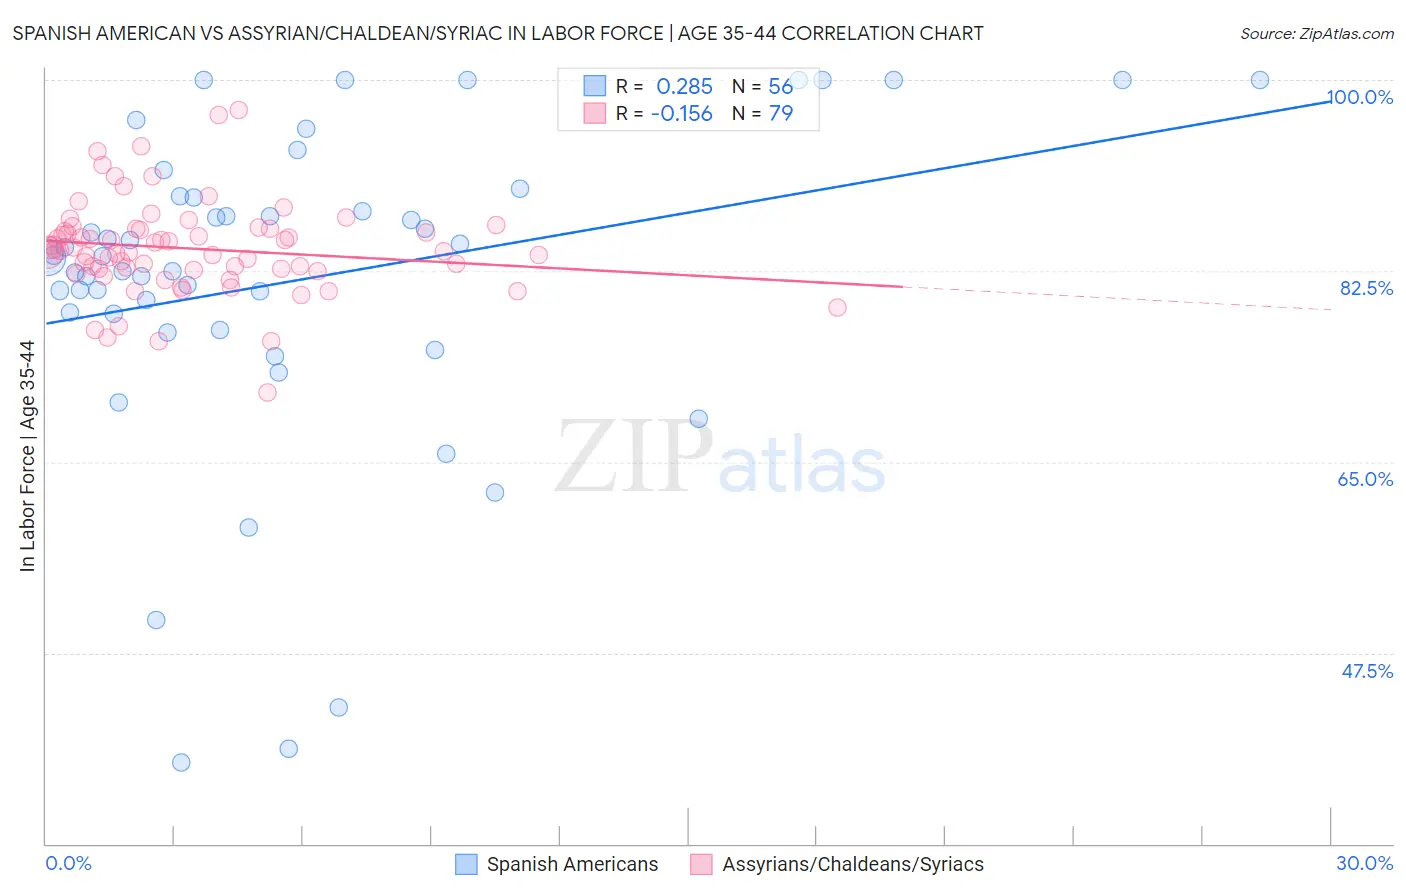
Spanish American vs Assyrian/Chaldean/Syriac In Labor Force | Age 35-44 Correlation Chart
The statistical analysis conducted on geographies consisting of 103,164,815 people shows a weak positive correlation between the proportion of Spanish Americans and labor force participation rate among population between the ages 35 and 44 in the United States with a correlation coefficient (R) of 0.285 and weighted average of 82.8%. Similarly, the statistical analysis conducted on geographies consisting of 110,311,119 people shows a poor negative correlation between the proportion of Assyrians/Chaldeans/Syriacs and labor force participation rate among population between the ages 35 and 44 in the United States with a correlation coefficient (R) of -0.156 and weighted average of 84.0%, a difference of 1.5%.
In Labor Force | Age 35-44 Correlation Summary
| Measurement | Spanish American | Assyrian/Chaldean/Syriac |
| Minimum | 37.5% | 71.4% |
| Maximum | 100.0% | 97.2% |
| Range | 62.5% | 25.8% |
| Mean | 81.7% | 84.5% |
| Median | 83.8% | 84.4% |
| Interquartile 25% (IQ1) | 77.8% | 82.6% |
| Interquartile 75% (IQ3) | 89.2% | 86.4% |
| Interquartile Range (IQR) | 11.4% | 3.8% |
| Standard Deviation (Sample) | 14.6% | 4.3% |
| Standard Deviation (Population) | 14.5% | 4.3% |
Similar Demographics by In Labor Force | Age 35-44
Demographics Similar to Spanish Americans by In Labor Force | Age 35-44
In terms of in labor force | age 35-44, the demographic groups most similar to Spanish Americans are Potawatomi (82.7%, a difference of 0.080%), Immigrants from Latin America (82.8%, a difference of 0.090%), Immigrants from Lebanon (82.7%, a difference of 0.13%), Pennsylvania German (82.9%, a difference of 0.14%), and African (82.9%, a difference of 0.16%).
| Demographics | Rating | Rank | In Labor Force | Age 35-44 |
| Immigrants | Bangladesh | 0.0 /100 | #286 | Tragic 82.9% |
| Immigrants | Belize | 0.0 /100 | #287 | Tragic 82.9% |
| Puget Sound Salish | 0.0 /100 | #288 | Tragic 82.9% |
| Chippewa | 0.0 /100 | #289 | Tragic 82.9% |
| Africans | 0.0 /100 | #290 | Tragic 82.9% |
| Pennsylvania Germans | 0.0 /100 | #291 | Tragic 82.9% |
| Immigrants | Latin America | 0.0 /100 | #292 | Tragic 82.8% |
| Spanish Americans | 0.0 /100 | #293 | Tragic 82.8% |
| Potawatomi | 0.0 /100 | #294 | Tragic 82.7% |
| Immigrants | Lebanon | 0.0 /100 | #295 | Tragic 82.7% |
| Mexican American Indians | 0.0 /100 | #296 | Tragic 82.6% |
| Hmong | 0.0 /100 | #297 | Tragic 82.6% |
| Ottawa | 0.0 /100 | #298 | Tragic 82.6% |
| Tlingit-Haida | 0.0 /100 | #299 | Tragic 82.5% |
| Central American Indians | 0.0 /100 | #300 | Tragic 82.5% |
Demographics Similar to Assyrians/Chaldeans/Syriacs by In Labor Force | Age 35-44
In terms of in labor force | age 35-44, the demographic groups most similar to Assyrians/Chaldeans/Syriacs are Icelander (84.0%, a difference of 0.0%), Immigrants from Panama (84.0%, a difference of 0.0%), U.S. Virgin Islander (84.0%, a difference of 0.010%), Immigrants from Burma/Myanmar (84.0%, a difference of 0.010%), and French (84.0%, a difference of 0.020%).
| Demographics | Rating | Rank | In Labor Force | Age 35-44 |
| Europeans | 12.2 /100 | #215 | Poor 84.1% |
| Nicaraguans | 12.1 /100 | #216 | Poor 84.1% |
| Immigrants | Norway | 11.7 /100 | #217 | Poor 84.1% |
| Immigrants | Nicaragua | 9.4 /100 | #218 | Tragic 84.1% |
| Sub-Saharan Africans | 9.3 /100 | #219 | Tragic 84.1% |
| French | 7.5 /100 | #220 | Tragic 84.0% |
| Icelanders | 6.7 /100 | #221 | Tragic 84.0% |
| Assyrians/Chaldeans/Syriacs | 6.6 /100 | #222 | Tragic 84.0% |
| Immigrants | Panama | 6.4 /100 | #223 | Tragic 84.0% |
| U.S. Virgin Islanders | 6.1 /100 | #224 | Tragic 84.0% |
| Immigrants | Burma/Myanmar | 6.1 /100 | #225 | Tragic 84.0% |
| Panamanians | 5.4 /100 | #226 | Tragic 84.0% |
| British West Indians | 5.3 /100 | #227 | Tragic 84.0% |
| Welsh | 5.3 /100 | #228 | Tragic 84.0% |
| Immigrants | Thailand | 4.7 /100 | #229 | Tragic 84.0% |