Immigrants from Portugal vs Assyrian/Chaldean/Syriac College, Under 1 year
COMPARE
Immigrants from Portugal
Assyrian/Chaldean/Syriac
College, Under 1 year
College, Under 1 year Comparison
Immigrants from Portugal
Assyrians/Chaldeans/Syriacs
57.7%
COLLEGE, UNDER 1 YEAR
0.0/ 100
METRIC RATING
306th/ 347
METRIC RANK
67.7%
COLLEGE, UNDER 1 YEAR
95.8/ 100
METRIC RATING
110th/ 347
METRIC RANK
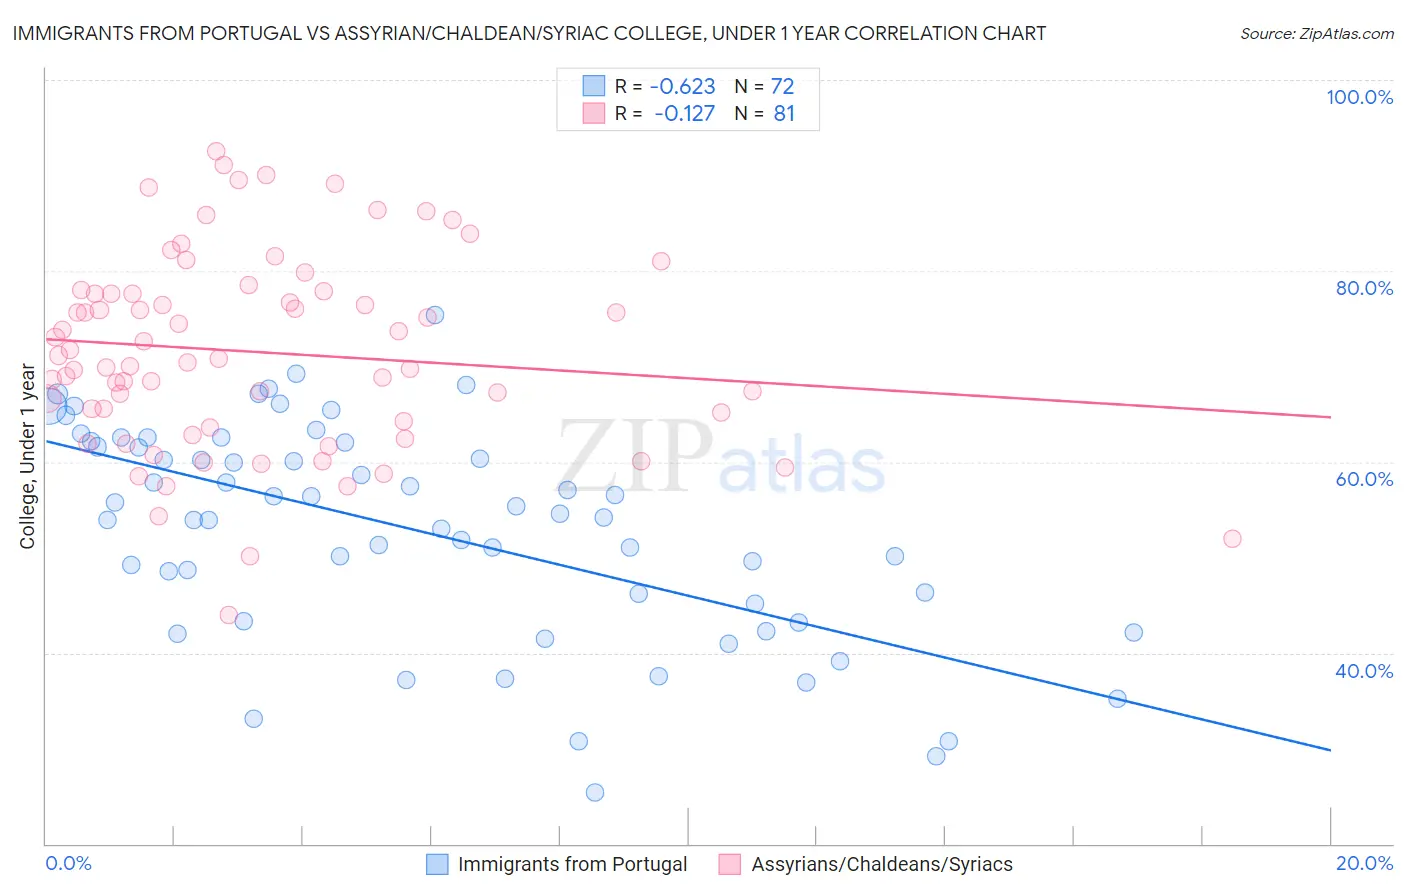
Immigrants from Portugal vs Assyrian/Chaldean/Syriac College, Under 1 year Correlation Chart
The statistical analysis conducted on geographies consisting of 174,792,047 people shows a significant negative correlation between the proportion of Immigrants from Portugal and percentage of population with at least college, under 1 year education in the United States with a correlation coefficient (R) of -0.623 and weighted average of 57.7%. Similarly, the statistical analysis conducted on geographies consisting of 110,318,304 people shows a poor negative correlation between the proportion of Assyrians/Chaldeans/Syriacs and percentage of population with at least college, under 1 year education in the United States with a correlation coefficient (R) of -0.127 and weighted average of 67.7%, a difference of 17.3%.
College, Under 1 year Correlation Summary
| Measurement | Immigrants from Portugal | Assyrian/Chaldean/Syriac |
| Minimum | 25.4% | 44.0% |
| Maximum | 75.4% | 92.5% |
| Range | 50.1% | 48.5% |
| Mean | 52.8% | 71.5% |
| Median | 54.4% | 70.8% |
| Interquartile 25% (IQ1) | 44.2% | 63.9% |
| Interquartile 75% (IQ3) | 61.8% | 77.8% |
| Interquartile Range (IQR) | 17.6% | 13.9% |
| Standard Deviation (Sample) | 11.2% | 10.2% |
| Standard Deviation (Population) | 11.1% | 10.2% |
Similar Demographics by College, Under 1 year
Demographics Similar to Immigrants from Portugal by College, Under 1 year
In terms of college, under 1 year, the demographic groups most similar to Immigrants from Portugal are Fijian (57.7%, a difference of 0.010%), Central American (57.7%, a difference of 0.010%), Immigrants from Nicaragua (57.6%, a difference of 0.14%), Haitian (57.8%, a difference of 0.20%), and Kiowa (57.8%, a difference of 0.31%).
| Demographics | Rating | Rank | College, Under 1 year |
| Cubans | 0.0 /100 | #299 | Tragic 58.6% |
| Immigrants | Guyana | 0.0 /100 | #300 | Tragic 58.5% |
| Mexican American Indians | 0.0 /100 | #301 | Tragic 58.1% |
| Apache | 0.0 /100 | #302 | Tragic 58.0% |
| Immigrants | Dominica | 0.0 /100 | #303 | Tragic 57.9% |
| Kiowa | 0.0 /100 | #304 | Tragic 57.8% |
| Haitians | 0.0 /100 | #305 | Tragic 57.8% |
| Immigrants | Portugal | 0.0 /100 | #306 | Tragic 57.7% |
| Fijians | 0.0 /100 | #307 | Tragic 57.7% |
| Central Americans | 0.0 /100 | #308 | Tragic 57.7% |
| Immigrants | Nicaragua | 0.0 /100 | #309 | Tragic 57.6% |
| Pueblo | 0.0 /100 | #310 | Tragic 57.4% |
| Cajuns | 0.0 /100 | #311 | Tragic 57.3% |
| Salvadorans | 0.0 /100 | #312 | Tragic 57.3% |
| Dutch West Indians | 0.0 /100 | #313 | Tragic 57.2% |
Demographics Similar to Assyrians/Chaldeans/Syriacs by College, Under 1 year
In terms of college, under 1 year, the demographic groups most similar to Assyrians/Chaldeans/Syriacs are Scandinavian (67.7%, a difference of 0.0%), Ukrainian (67.7%, a difference of 0.0%), Macedonian (67.6%, a difference of 0.020%), Syrian (67.6%, a difference of 0.040%), and Immigrants from Egypt (67.7%, a difference of 0.060%).
| Demographics | Rating | Rank | College, Under 1 year |
| Carpatho Rusyns | 96.8 /100 | #103 | Exceptional 67.9% |
| Immigrants | Western Asia | 96.6 /100 | #104 | Exceptional 67.8% |
| Afghans | 96.6 /100 | #105 | Exceptional 67.8% |
| Immigrants | Croatia | 96.6 /100 | #106 | Exceptional 67.8% |
| Austrians | 96.4 /100 | #107 | Exceptional 67.8% |
| Immigrants | Egypt | 96.0 /100 | #108 | Exceptional 67.7% |
| Scandinavians | 95.8 /100 | #109 | Exceptional 67.7% |
| Assyrians/Chaldeans/Syriacs | 95.8 /100 | #110 | Exceptional 67.7% |
| Ukrainians | 95.8 /100 | #111 | Exceptional 67.7% |
| Macedonians | 95.7 /100 | #112 | Exceptional 67.6% |
| Syrians | 95.6 /100 | #113 | Exceptional 67.6% |
| Chileans | 95.3 /100 | #114 | Exceptional 67.6% |
| Basques | 95.2 /100 | #115 | Exceptional 67.6% |
| Immigrants | Nepal | 94.9 /100 | #116 | Exceptional 67.5% |
| Pakistanis | 94.8 /100 | #117 | Exceptional 67.5% |