Spanish American Indian vs Dominican Associate's Degree
COMPARE
Spanish American Indian
Dominican
Associate's Degree
Associate's Degree Comparison
Spanish American Indians
Dominicans
34.9%
ASSOCIATE'S DEGREE
0.0/ 100
METRIC RATING
335th/ 347
METRIC RANK
39.3%
ASSOCIATE'S DEGREE
0.0/ 100
METRIC RATING
291st/ 347
METRIC RANK
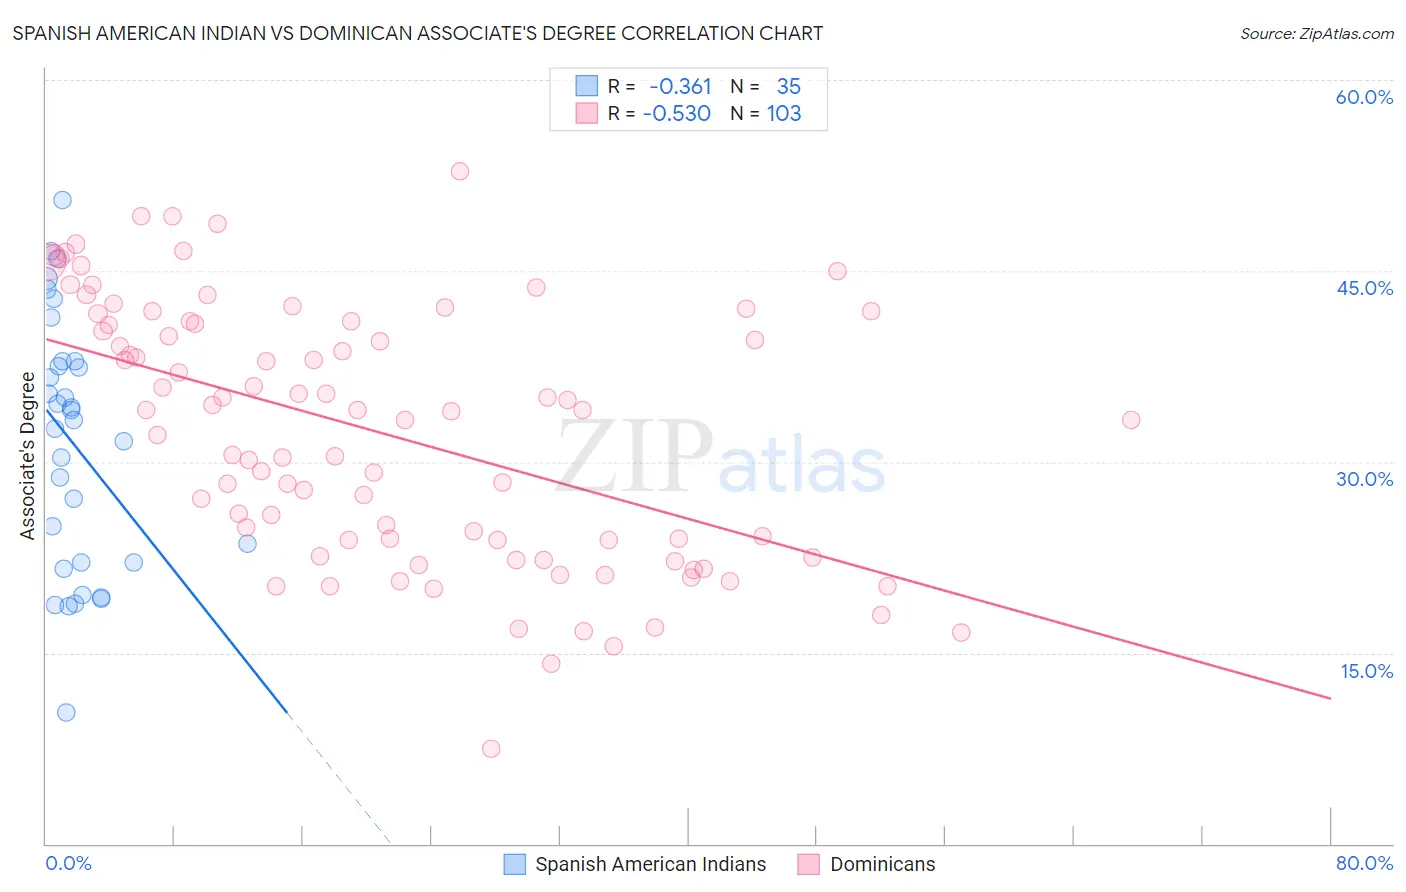
Spanish American Indian vs Dominican Associate's Degree Correlation Chart
The statistical analysis conducted on geographies consisting of 73,150,359 people shows a mild negative correlation between the proportion of Spanish American Indians and percentage of population with at least associate's degree education in the United States with a correlation coefficient (R) of -0.361 and weighted average of 34.9%. Similarly, the statistical analysis conducted on geographies consisting of 355,098,353 people shows a substantial negative correlation between the proportion of Dominicans and percentage of population with at least associate's degree education in the United States with a correlation coefficient (R) of -0.530 and weighted average of 39.3%, a difference of 12.6%.
Associate's Degree Correlation Summary
| Measurement | Spanish American Indian | Dominican |
| Minimum | 10.3% | 7.4% |
| Maximum | 50.6% | 52.8% |
| Range | 40.3% | 45.4% |
| Mean | 31.4% | 32.3% |
| Median | 33.2% | 34.0% |
| Interquartile 25% (IQ1) | 22.0% | 23.8% |
| Interquartile 75% (IQ3) | 37.9% | 41.0% |
| Interquartile Range (IQR) | 15.8% | 17.2% |
| Standard Deviation (Sample) | 9.9% | 10.0% |
| Standard Deviation (Population) | 9.8% | 10.0% |
Similar Demographics by Associate's Degree
Demographics Similar to Spanish American Indians by Associate's Degree
In terms of associate's degree, the demographic groups most similar to Spanish American Indians are Native/Alaskan (34.9%, a difference of 0.14%), Mexican (35.0%, a difference of 0.37%), Immigrants from Central America (35.0%, a difference of 0.45%), Hopi (34.6%, a difference of 0.88%), and Lumbee (34.1%, a difference of 2.2%).
| Demographics | Rating | Rank | Associate's Degree |
| Alaskan Athabascans | 0.0 /100 | #328 | Tragic 36.5% |
| Paiute | 0.0 /100 | #329 | Tragic 36.4% |
| Apache | 0.0 /100 | #330 | Tragic 36.2% |
| Immigrants | Azores | 0.0 /100 | #331 | Tragic 35.6% |
| Immigrants | Central America | 0.0 /100 | #332 | Tragic 35.0% |
| Mexicans | 0.0 /100 | #333 | Tragic 35.0% |
| Natives/Alaskans | 0.0 /100 | #334 | Tragic 34.9% |
| Spanish American Indians | 0.0 /100 | #335 | Tragic 34.9% |
| Hopi | 0.0 /100 | #336 | Tragic 34.6% |
| Lumbee | 0.0 /100 | #337 | Tragic 34.1% |
| Pueblo | 0.0 /100 | #338 | Tragic 34.0% |
| Immigrants | Mexico | 0.0 /100 | #339 | Tragic 33.7% |
| Navajo | 0.0 /100 | #340 | Tragic 32.6% |
| Inupiat | 0.0 /100 | #341 | Tragic 32.6% |
| Yakama | 0.0 /100 | #342 | Tragic 32.3% |
Demographics Similar to Dominicans by Associate's Degree
In terms of associate's degree, the demographic groups most similar to Dominicans are Immigrants from Haiti (39.3%, a difference of 0.010%), Black/African American (39.1%, a difference of 0.29%), Central American (39.4%, a difference of 0.46%), Nepalese (39.0%, a difference of 0.54%), and Salvadoran (39.0%, a difference of 0.54%).
| Demographics | Rating | Rank | Associate's Degree |
| Comanche | 0.1 /100 | #284 | Tragic 39.9% |
| Immigrants | Belize | 0.1 /100 | #285 | Tragic 39.9% |
| Immigrants | Caribbean | 0.0 /100 | #286 | Tragic 39.7% |
| Aleuts | 0.0 /100 | #287 | Tragic 39.6% |
| Immigrants | Cuba | 0.0 /100 | #288 | Tragic 39.5% |
| Central Americans | 0.0 /100 | #289 | Tragic 39.4% |
| Immigrants | Haiti | 0.0 /100 | #290 | Tragic 39.3% |
| Dominicans | 0.0 /100 | #291 | Tragic 39.3% |
| Blacks/African Americans | 0.0 /100 | #292 | Tragic 39.1% |
| Nepalese | 0.0 /100 | #293 | Tragic 39.0% |
| Salvadorans | 0.0 /100 | #294 | Tragic 39.0% |
| Hondurans | 0.0 /100 | #295 | Tragic 38.9% |
| Cherokee | 0.0 /100 | #296 | Tragic 38.9% |
| Cape Verdeans | 0.0 /100 | #297 | Tragic 38.8% |
| Cheyenne | 0.0 /100 | #298 | Tragic 38.7% |