Colville vs Sudanese 8th Grade
COMPARE
Colville
Sudanese
8th Grade
8th Grade Comparison
Colville
Sudanese
96.0%
8TH GRADE
84.0/ 100
METRIC RATING
147th/ 347
METRIC RANK
95.6%
8TH GRADE
33.0/ 100
METRIC RATING
187th/ 347
METRIC RANK
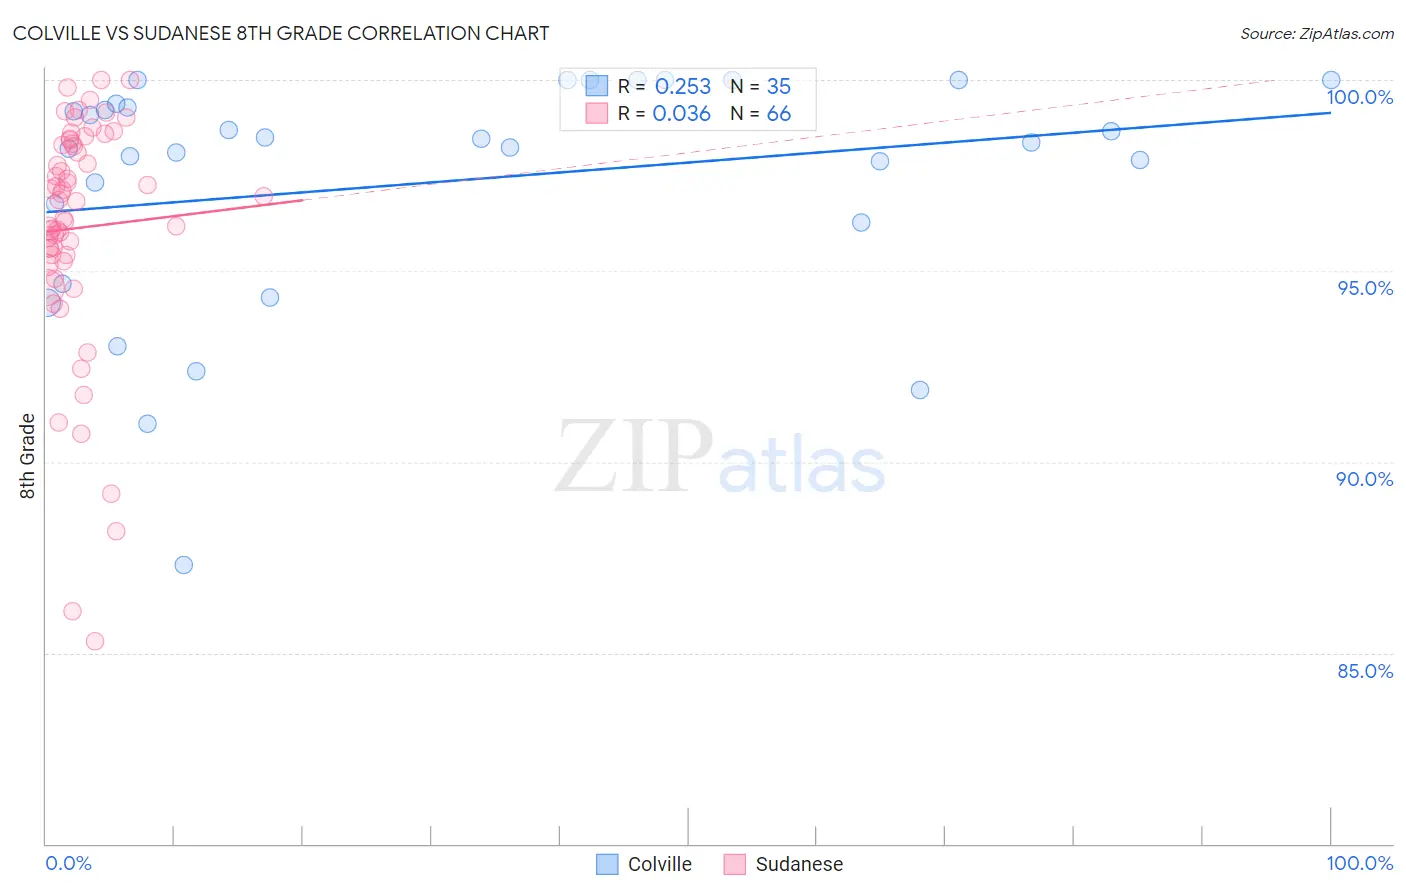
Colville vs Sudanese 8th Grade Correlation Chart
The statistical analysis conducted on geographies consisting of 34,682,094 people shows a weak positive correlation between the proportion of Colville and percentage of population with at least 8th grade education in the United States with a correlation coefficient (R) of 0.253 and weighted average of 96.0%. Similarly, the statistical analysis conducted on geographies consisting of 110,124,633 people shows no correlation between the proportion of Sudanese and percentage of population with at least 8th grade education in the United States with a correlation coefficient (R) of 0.036 and weighted average of 95.6%, a difference of 0.38%.
8th Grade Correlation Summary
| Measurement | Colville | Sudanese |
| Minimum | 87.3% | 85.3% |
| Maximum | 100.0% | 100.0% |
| Range | 12.7% | 14.7% |
| Mean | 97.3% | 96.1% |
| Median | 98.4% | 96.8% |
| Interquartile 25% (IQ1) | 96.3% | 95.4% |
| Interquartile 75% (IQ3) | 99.4% | 98.3% |
| Interquartile Range (IQR) | 3.1% | 2.9% |
| Standard Deviation (Sample) | 3.1% | 3.1% |
| Standard Deviation (Population) | 3.1% | 3.1% |
Similar Demographics by 8th Grade
Demographics Similar to Colville by 8th Grade
In terms of 8th grade, the demographic groups most similar to Colville are Lumbee (96.0%, a difference of 0.0%), Israeli (96.0%, a difference of 0.0%), Spanish (96.0%, a difference of 0.010%), Immigrants from Belarus (96.0%, a difference of 0.010%), and Albanian (96.0%, a difference of 0.010%).
| Demographics | Rating | Rank | 8th Grade |
| Immigrants | South Central Asia | 89.4 /100 | #140 | Excellent 96.1% |
| Immigrants | Greece | 85.9 /100 | #141 | Excellent 96.0% |
| Immigrants | Eastern Europe | 85.4 /100 | #142 | Excellent 96.0% |
| Spanish | 85.1 /100 | #143 | Excellent 96.0% |
| Immigrants | Belarus | 84.8 /100 | #144 | Excellent 96.0% |
| Lumbee | 84.1 /100 | #145 | Excellent 96.0% |
| Israelis | 84.1 /100 | #146 | Excellent 96.0% |
| Colville | 84.0 /100 | #147 | Excellent 96.0% |
| Albanians | 83.1 /100 | #148 | Excellent 96.0% |
| Immigrants | Israel | 81.3 /100 | #149 | Excellent 96.0% |
| Immigrants | Russia | 80.9 /100 | #150 | Excellent 96.0% |
| Blackfeet | 80.8 /100 | #151 | Excellent 96.0% |
| French American Indians | 80.6 /100 | #152 | Excellent 96.0% |
| Immigrants | Jordan | 79.5 /100 | #153 | Good 95.9% |
| Hopi | 79.4 /100 | #154 | Good 95.9% |
Demographics Similar to Sudanese by 8th Grade
In terms of 8th grade, the demographic groups most similar to Sudanese are Liberian (95.6%, a difference of 0.0%), Black/African American (95.6%, a difference of 0.010%), Brazilian (95.6%, a difference of 0.010%), Immigrants from Micronesia (95.6%, a difference of 0.010%), and Immigrants from Iraq (95.6%, a difference of 0.020%).
| Demographics | Rating | Rank | 8th Grade |
| Iraqis | 40.5 /100 | #180 | Average 95.7% |
| Immigrants | Spain | 38.7 /100 | #181 | Fair 95.7% |
| Immigrants | Egypt | 37.9 /100 | #182 | Fair 95.7% |
| Immigrants | Iraq | 36.2 /100 | #183 | Fair 95.6% |
| Immigrants | Uganda | 36.0 /100 | #184 | Fair 95.6% |
| Blacks/African Americans | 34.8 /100 | #185 | Fair 95.6% |
| Brazilians | 34.8 /100 | #186 | Fair 95.6% |
| Sudanese | 33.0 /100 | #187 | Fair 95.6% |
| Liberians | 32.4 /100 | #188 | Fair 95.6% |
| Immigrants | Micronesia | 31.6 /100 | #189 | Fair 95.6% |
| Immigrants | Venezuela | 30.8 /100 | #190 | Fair 95.6% |
| Immigrants | Nepal | 30.2 /100 | #191 | Fair 95.6% |
| Pima | 28.6 /100 | #192 | Fair 95.6% |
| Panamanians | 28.4 /100 | #193 | Fair 95.6% |
| Guamanians/Chamorros | 26.6 /100 | #194 | Fair 95.6% |