Spaniard vs Sudanese 2nd Grade
COMPARE
Spaniard
Sudanese
2nd Grade
2nd Grade Comparison
Spaniards
Sudanese
98.0%
2ND GRADE
90.7/ 100
METRIC RATING
132nd/ 347
METRIC RANK
97.7%
2ND GRADE
5.7/ 100
METRIC RATING
218th/ 347
METRIC RANK
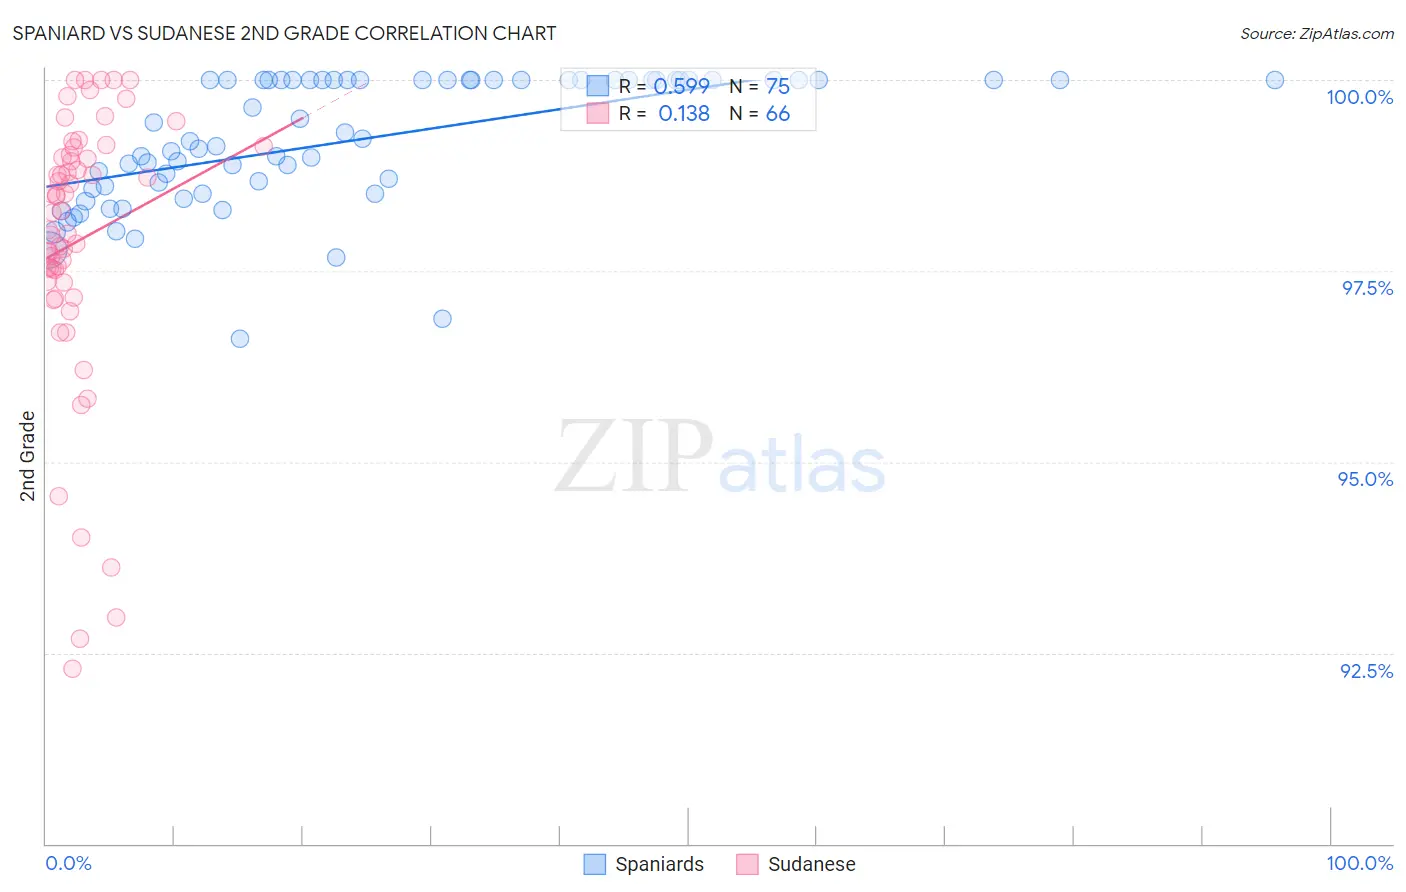
Spaniard vs Sudanese 2nd Grade Correlation Chart
The statistical analysis conducted on geographies consisting of 443,544,503 people shows a substantial positive correlation between the proportion of Spaniards and percentage of population with at least 2nd grade education in the United States with a correlation coefficient (R) of 0.599 and weighted average of 98.0%. Similarly, the statistical analysis conducted on geographies consisting of 110,135,898 people shows a poor positive correlation between the proportion of Sudanese and percentage of population with at least 2nd grade education in the United States with a correlation coefficient (R) of 0.138 and weighted average of 97.7%, a difference of 0.40%.
2nd Grade Correlation Summary
| Measurement | Spaniard | Sudanese |
| Minimum | 96.6% | 92.3% |
| Maximum | 100.0% | 100.0% |
| Range | 3.4% | 7.7% |
| Mean | 99.2% | 97.9% |
| Median | 99.2% | 98.3% |
| Interquartile 25% (IQ1) | 98.6% | 97.4% |
| Interquartile 75% (IQ3) | 100.0% | 99.0% |
| Interquartile Range (IQR) | 1.4% | 1.6% |
| Standard Deviation (Sample) | 0.85% | 1.8% |
| Standard Deviation (Population) | 0.84% | 1.8% |
Similar Demographics by 2nd Grade
Demographics Similar to Spaniards by 2nd Grade
In terms of 2nd grade, the demographic groups most similar to Spaniards are Seminole (98.0%, a difference of 0.0%), Immigrants from Europe (98.0%, a difference of 0.0%), Cambodian (98.0%, a difference of 0.0%), Immigrants from Croatia (98.1%, a difference of 0.010%), and Immigrants from Hungary (98.0%, a difference of 0.010%).
| Demographics | Rating | Rank | 2nd Grade |
| Iroquois | 94.1 /100 | #125 | Exceptional 98.1% |
| Syrians | 94.0 /100 | #126 | Exceptional 98.1% |
| Immigrants | Saudi Arabia | 93.6 /100 | #127 | Exceptional 98.1% |
| Immigrants | Serbia | 92.3 /100 | #128 | Exceptional 98.1% |
| Immigrants | Croatia | 92.1 /100 | #129 | Exceptional 98.1% |
| Seminole | 91.1 /100 | #130 | Exceptional 98.0% |
| Immigrants | Europe | 91.1 /100 | #131 | Exceptional 98.0% |
| Spaniards | 90.7 /100 | #132 | Exceptional 98.0% |
| Cambodians | 90.7 /100 | #133 | Exceptional 98.0% |
| Immigrants | Hungary | 89.7 /100 | #134 | Excellent 98.0% |
| Immigrants | Bulgaria | 89.7 /100 | #135 | Excellent 98.0% |
| Immigrants | Kuwait | 89.2 /100 | #136 | Excellent 98.0% |
| Immigrants | Romania | 88.3 /100 | #137 | Excellent 98.0% |
| Israelis | 87.9 /100 | #138 | Excellent 98.0% |
| Blackfeet | 87.5 /100 | #139 | Excellent 98.0% |
Demographics Similar to Sudanese by 2nd Grade
In terms of 2nd grade, the demographic groups most similar to Sudanese are South American Indian (97.7%, a difference of 0.010%), Uruguayan (97.7%, a difference of 0.010%), Immigrants from Panama (97.6%, a difference of 0.010%), Immigrants from Morocco (97.6%, a difference of 0.010%), and Samoan (97.7%, a difference of 0.020%).
| Demographics | Rating | Rank | 2nd Grade |
| Laotians | 9.9 /100 | #211 | Tragic 97.7% |
| Immigrants | Bahamas | 8.4 /100 | #212 | Tragic 97.7% |
| Moroccans | 8.2 /100 | #213 | Tragic 97.7% |
| Samoans | 7.1 /100 | #214 | Tragic 97.7% |
| Bahamians | 6.8 /100 | #215 | Tragic 97.7% |
| South American Indians | 6.7 /100 | #216 | Tragic 97.7% |
| Uruguayans | 6.2 /100 | #217 | Tragic 97.7% |
| Sudanese | 5.7 /100 | #218 | Tragic 97.7% |
| Immigrants | Panama | 5.1 /100 | #219 | Tragic 97.6% |
| Immigrants | Morocco | 5.0 /100 | #220 | Tragic 97.6% |
| Iraqis | 4.6 /100 | #221 | Tragic 97.6% |
| Immigrants | Sudan | 4.5 /100 | #222 | Tragic 97.6% |
| Sierra Leoneans | 4.3 /100 | #223 | Tragic 97.6% |
| Immigrants | Zaire | 4.3 /100 | #224 | Tragic 97.6% |
| Tongans | 4.3 /100 | #225 | Tragic 97.6% |