Costa Rican vs Japanese Master's Degree
COMPARE
Costa Rican
Japanese
Master's Degree
Master's Degree Comparison
Costa Ricans
Japanese
15.0%
MASTER'S DEGREE
52.5/ 100
METRIC RATING
173rd/ 347
METRIC RANK
12.5%
MASTER'S DEGREE
0.6/ 100
METRIC RATING
259th/ 347
METRIC RANK
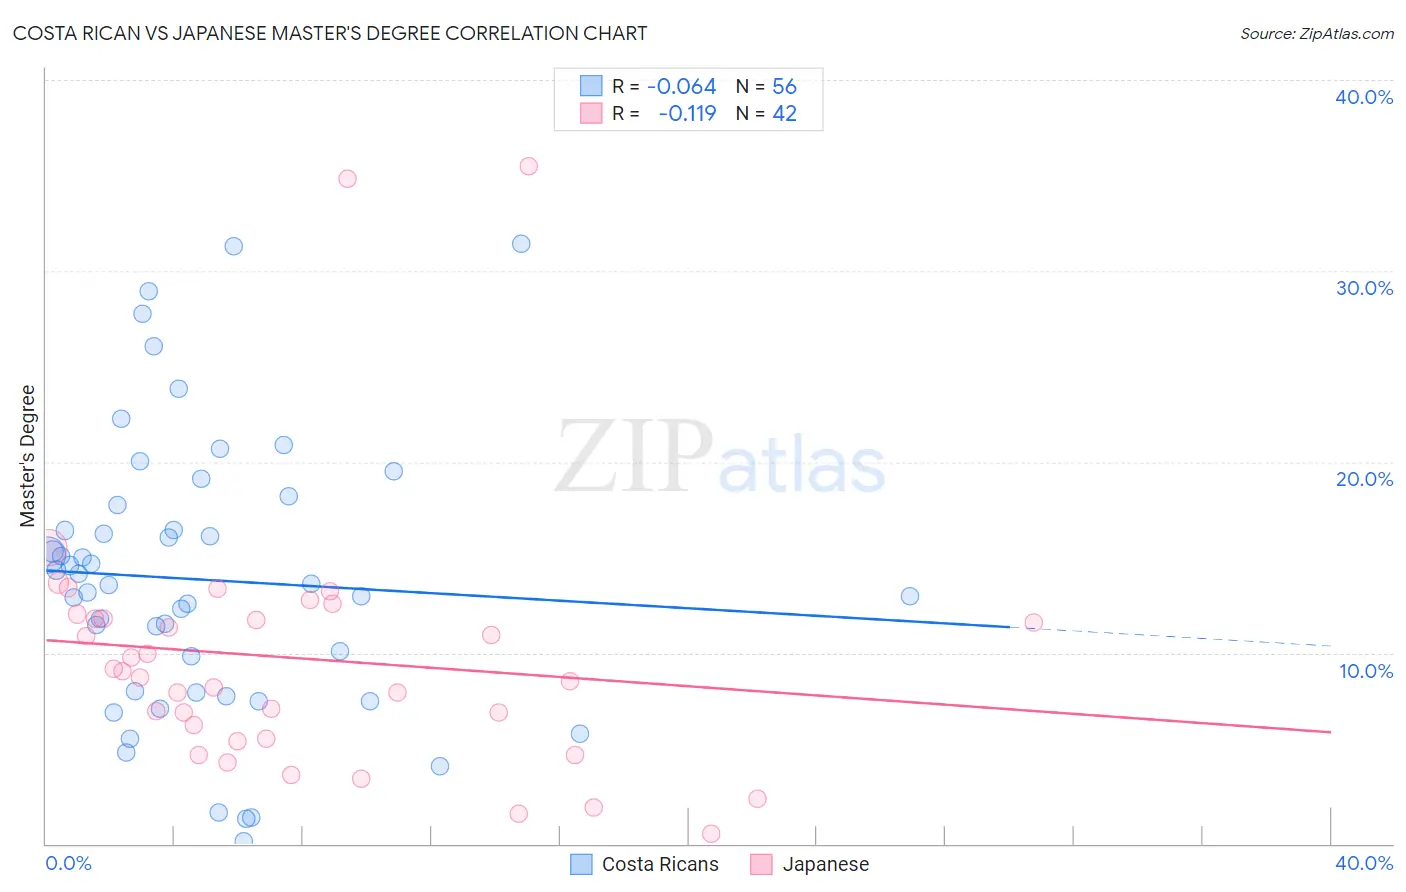
Costa Rican vs Japanese Master's Degree Correlation Chart
The statistical analysis conducted on geographies consisting of 253,588,178 people shows a slight negative correlation between the proportion of Costa Ricans and percentage of population with at least master's degree education in the United States with a correlation coefficient (R) of -0.064 and weighted average of 15.0%. Similarly, the statistical analysis conducted on geographies consisting of 249,128,490 people shows a poor negative correlation between the proportion of Japanese and percentage of population with at least master's degree education in the United States with a correlation coefficient (R) of -0.119 and weighted average of 12.5%, a difference of 19.8%.
Master's Degree Correlation Summary
| Measurement | Costa Rican | Japanese |
| Minimum | 0.13% | 0.51% |
| Maximum | 31.4% | 35.5% |
| Range | 31.3% | 35.0% |
| Mean | 13.8% | 9.7% |
| Median | 13.6% | 8.9% |
| Interquartile 25% (IQ1) | 8.0% | 5.5% |
| Interquartile 75% (IQ3) | 17.1% | 11.8% |
| Interquartile Range (IQR) | 9.1% | 6.3% |
| Standard Deviation (Sample) | 7.3% | 6.9% |
| Standard Deviation (Population) | 7.2% | 6.8% |
Similar Demographics by Master's Degree
Demographics Similar to Costa Ricans by Master's Degree
In terms of master's degree, the demographic groups most similar to Costa Ricans are Immigrants from Uruguay (15.0%, a difference of 0.040%), Immigrants from Ghana (15.0%, a difference of 0.14%), Slovak (14.9%, a difference of 0.32%), Immigrants from Peru (14.9%, a difference of 0.36%), and Irish (15.0%, a difference of 0.50%).
| Demographics | Rating | Rank | Master's Degree |
| Swedes | 66.1 /100 | #166 | Good 15.2% |
| Senegalese | 65.6 /100 | #167 | Good 15.2% |
| Immigrants | North Macedonia | 64.5 /100 | #168 | Good 15.2% |
| Scottish | 62.7 /100 | #169 | Good 15.2% |
| Irish | 56.3 /100 | #170 | Average 15.0% |
| Immigrants | Ghana | 53.6 /100 | #171 | Average 15.0% |
| Immigrants | Uruguay | 52.8 /100 | #172 | Average 15.0% |
| Costa Ricans | 52.5 /100 | #173 | Average 15.0% |
| Slovaks | 50.0 /100 | #174 | Average 14.9% |
| Immigrants | Peru | 49.6 /100 | #175 | Average 14.9% |
| Nigerians | 48.6 /100 | #176 | Average 14.9% |
| Immigrants | Colombia | 48.3 /100 | #177 | Average 14.9% |
| English | 45.0 /100 | #178 | Average 14.8% |
| Immigrants | Iraq | 41.3 /100 | #179 | Average 14.8% |
| Celtics | 41.3 /100 | #180 | Average 14.8% |
Demographics Similar to Japanese by Master's Degree
In terms of master's degree, the demographic groups most similar to Japanese are Dominican (12.5%, a difference of 0.010%), Tongan (12.5%, a difference of 0.040%), Immigrants from Liberia (12.5%, a difference of 0.090%), Nicaraguan (12.5%, a difference of 0.23%), and Central American Indian (12.4%, a difference of 0.46%).
| Demographics | Rating | Rank | Master's Degree |
| French American Indians | 1.0 /100 | #252 | Tragic 12.7% |
| Immigrants | Dominica | 0.8 /100 | #253 | Tragic 12.6% |
| Indonesians | 0.8 /100 | #254 | Tragic 12.6% |
| Immigrants | Congo | 0.8 /100 | #255 | Tragic 12.6% |
| Immigrants | Portugal | 0.8 /100 | #256 | Tragic 12.6% |
| Osage | 0.7 /100 | #257 | Tragic 12.6% |
| Immigrants | Liberia | 0.6 /100 | #258 | Tragic 12.5% |
| Japanese | 0.6 /100 | #259 | Tragic 12.5% |
| Dominicans | 0.6 /100 | #260 | Tragic 12.5% |
| Tongans | 0.6 /100 | #261 | Tragic 12.5% |
| Nicaraguans | 0.6 /100 | #262 | Tragic 12.5% |
| Central American Indians | 0.5 /100 | #263 | Tragic 12.4% |
| Belizeans | 0.5 /100 | #264 | Tragic 12.4% |
| Immigrants | Fiji | 0.5 /100 | #265 | Tragic 12.4% |
| Bahamians | 0.5 /100 | #266 | Tragic 12.4% |