Spaniard vs Immigrants from Middle Africa Professional Degree
COMPARE
Spaniard
Immigrants from Middle Africa
Professional Degree
Professional Degree Comparison
Spaniards
Immigrants from Middle Africa
4.4%
PROFESSIONAL DEGREE
52.0/ 100
METRIC RATING
172nd/ 347
METRIC RANK
4.2%
PROFESSIONAL DEGREE
22.1/ 100
METRIC RATING
198th/ 347
METRIC RANK
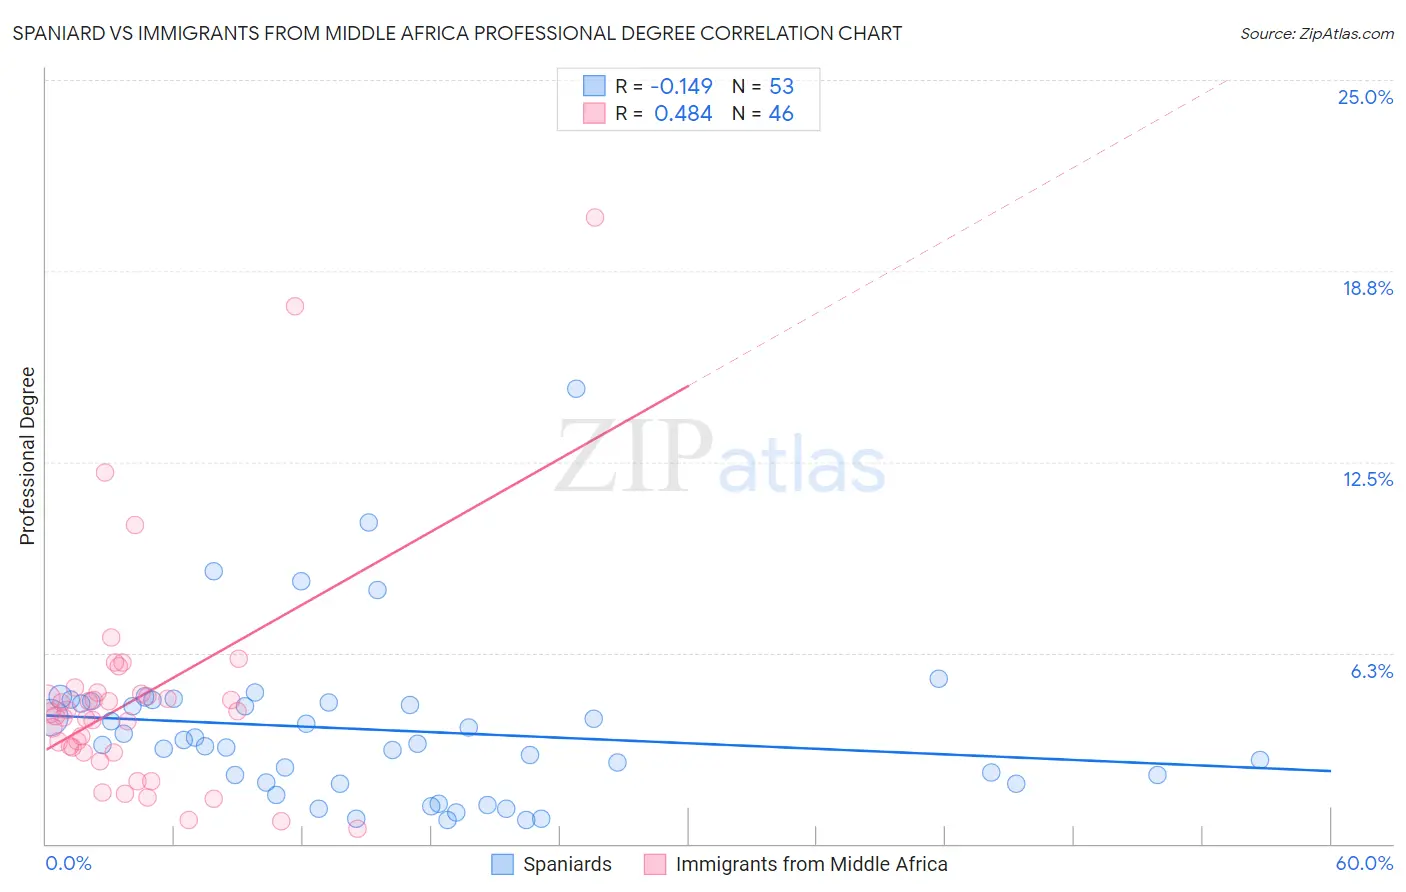
Spaniard vs Immigrants from Middle Africa Professional Degree Correlation Chart
The statistical analysis conducted on geographies consisting of 441,720,376 people shows a poor negative correlation between the proportion of Spaniards and percentage of population with at least professional degree education in the United States with a correlation coefficient (R) of -0.149 and weighted average of 4.4%. Similarly, the statistical analysis conducted on geographies consisting of 202,537,190 people shows a moderate positive correlation between the proportion of Immigrants from Middle Africa and percentage of population with at least professional degree education in the United States with a correlation coefficient (R) of 0.484 and weighted average of 4.2%, a difference of 5.1%.
Professional Degree Correlation Summary
| Measurement | Spaniard | Immigrants from Middle Africa |
| Minimum | 0.77% | 0.49% |
| Maximum | 14.9% | 20.5% |
| Range | 14.1% | 20.0% |
| Mean | 3.7% | 4.8% |
| Median | 3.3% | 4.2% |
| Interquartile 25% (IQ1) | 2.0% | 3.0% |
| Interquartile 75% (IQ3) | 4.7% | 4.9% |
| Interquartile Range (IQR) | 2.7% | 1.9% |
| Standard Deviation (Sample) | 2.6% | 3.8% |
| Standard Deviation (Population) | 2.6% | 3.7% |
Similar Demographics by Professional Degree
Demographics Similar to Spaniards by Professional Degree
In terms of professional degree, the demographic groups most similar to Spaniards are English (4.4%, a difference of 0.28%), Kenyan (4.4%, a difference of 0.29%), Irish (4.4%, a difference of 0.30%), Immigrants from Peru (4.4%, a difference of 0.39%), and Immigrants from Bangladesh (4.4%, a difference of 0.57%).
| Demographics | Rating | Rank | Professional Degree |
| Costa Ricans | 59.9 /100 | #165 | Average 4.5% |
| Immigrants | Colombia | 59.4 /100 | #166 | Average 4.5% |
| Immigrants | Afghanistan | 59.2 /100 | #167 | Average 4.5% |
| Immigrants | Sierra Leone | 58.7 /100 | #168 | Average 4.5% |
| Chinese | 58.6 /100 | #169 | Average 4.5% |
| Immigrants | Zaire | 57.4 /100 | #170 | Average 4.5% |
| Immigrants | Bangladesh | 56.0 /100 | #171 | Average 4.4% |
| Spaniards | 52.0 /100 | #172 | Average 4.4% |
| English | 50.1 /100 | #173 | Average 4.4% |
| Kenyans | 50.0 /100 | #174 | Average 4.4% |
| Irish | 50.0 /100 | #175 | Average 4.4% |
| Immigrants | Peru | 49.3 /100 | #176 | Average 4.4% |
| Celtics | 47.6 /100 | #177 | Average 4.4% |
| Immigrants | Costa Rica | 46.7 /100 | #178 | Average 4.4% |
| Immigrants | Kenya | 45.9 /100 | #179 | Average 4.4% |
Demographics Similar to Immigrants from Middle Africa by Professional Degree
In terms of professional degree, the demographic groups most similar to Immigrants from Middle Africa are Czechoslovakian (4.2%, a difference of 0.050%), Spanish (4.2%, a difference of 0.19%), Norwegian (4.2%, a difference of 0.37%), Immigrants from North Macedonia (4.2%, a difference of 0.44%), and Nigerian (4.2%, a difference of 0.52%).
| Demographics | Rating | Rank | Professional Degree |
| Sri Lankans | 29.0 /100 | #191 | Fair 4.3% |
| Ghanaians | 27.3 /100 | #192 | Fair 4.3% |
| French | 27.1 /100 | #193 | Fair 4.2% |
| Scandinavians | 25.8 /100 | #194 | Fair 4.2% |
| Nigerians | 24.6 /100 | #195 | Fair 4.2% |
| Spanish | 23.0 /100 | #196 | Fair 4.2% |
| Czechoslovakians | 22.4 /100 | #197 | Fair 4.2% |
| Immigrants | Middle Africa | 22.1 /100 | #198 | Fair 4.2% |
| Norwegians | 20.5 /100 | #199 | Fair 4.2% |
| Immigrants | North Macedonia | 20.2 /100 | #200 | Fair 4.2% |
| Finns | 18.7 /100 | #201 | Poor 4.2% |
| Immigrants | Iraq | 17.1 /100 | #202 | Poor 4.2% |
| Panamanians | 15.9 /100 | #203 | Poor 4.1% |
| Barbadians | 15.8 /100 | #204 | Poor 4.1% |
| Somalis | 14.8 /100 | #205 | Poor 4.1% |