Spaniard vs Immigrants from Middle Africa No Vehicles in Household
COMPARE
Spaniard
Immigrants from Middle Africa
No Vehicles in Household
No Vehicles in Household Comparison
Spaniards
Immigrants from Middle Africa
8.4%
NO VEHICLES IN HOUSEHOLD
99.7/ 100
METRIC RATING
69th/ 347
METRIC RANK
10.2%
NO VEHICLES IN HOUSEHOLD
65.7/ 100
METRIC RATING
160th/ 347
METRIC RANK
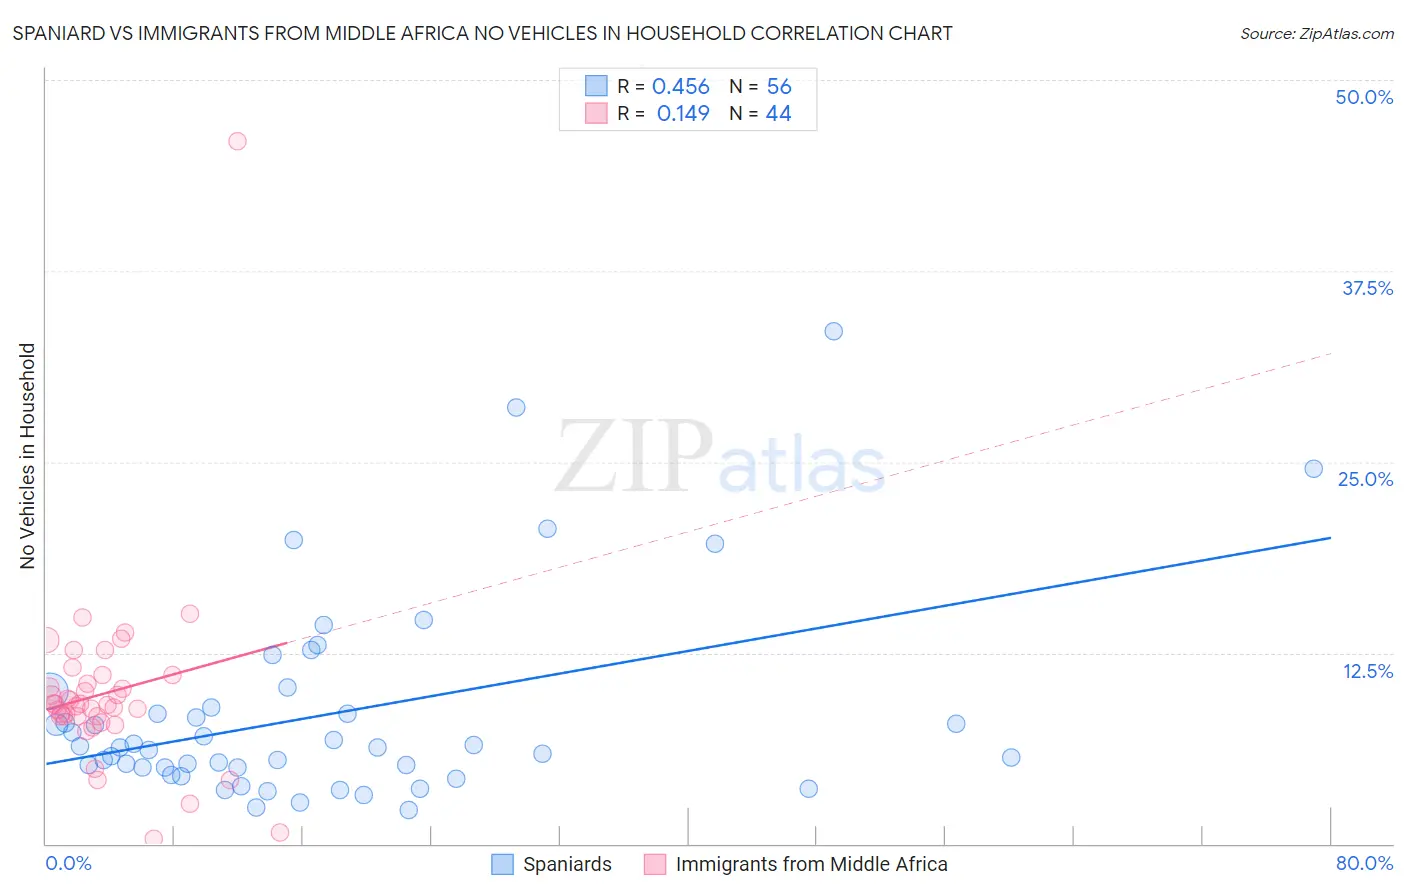
Spaniard vs Immigrants from Middle Africa No Vehicles in Household Correlation Chart
The statistical analysis conducted on geographies consisting of 441,901,498 people shows a moderate positive correlation between the proportion of Spaniards and percentage of households with no vehicle available in the United States with a correlation coefficient (R) of 0.456 and weighted average of 8.4%. Similarly, the statistical analysis conducted on geographies consisting of 202,497,217 people shows a poor positive correlation between the proportion of Immigrants from Middle Africa and percentage of households with no vehicle available in the United States with a correlation coefficient (R) of 0.149 and weighted average of 10.2%, a difference of 21.6%.
No Vehicles in Household Correlation Summary
| Measurement | Spaniard | Immigrants from Middle Africa |
| Minimum | 2.2% | 0.36% |
| Maximum | 33.6% | 46.0% |
| Range | 31.3% | 45.6% |
| Mean | 8.5% | 9.8% |
| Median | 6.3% | 9.1% |
| Interquartile 25% (IQ1) | 5.0% | 8.3% |
| Interquartile 75% (IQ3) | 8.7% | 10.7% |
| Interquartile Range (IQR) | 3.7% | 2.4% |
| Standard Deviation (Sample) | 6.5% | 6.4% |
| Standard Deviation (Population) | 6.4% | 6.3% |
Similar Demographics by No Vehicles in Household
Demographics Similar to Spaniards by No Vehicles in Household
In terms of no vehicles in household, the demographic groups most similar to Spaniards are Immigrants from Iran (8.4%, a difference of 0.050%), Immigrants from Scotland (8.3%, a difference of 0.45%), Palestinian (8.3%, a difference of 0.46%), Canadian (8.3%, a difference of 0.57%), and Cajun (8.4%, a difference of 0.72%).
| Demographics | Rating | Rank | No Vehicles in Household |
| Chinese | 99.8 /100 | #62 | Exceptional 8.2% |
| Slovaks | 99.8 /100 | #63 | Exceptional 8.3% |
| Croatians | 99.8 /100 | #64 | Exceptional 8.3% |
| Canadians | 99.7 /100 | #65 | Exceptional 8.3% |
| Palestinians | 99.7 /100 | #66 | Exceptional 8.3% |
| Immigrants | Scotland | 99.7 /100 | #67 | Exceptional 8.3% |
| Immigrants | Iran | 99.7 /100 | #68 | Exceptional 8.4% |
| Spaniards | 99.7 /100 | #69 | Exceptional 8.4% |
| Cajuns | 99.6 /100 | #70 | Exceptional 8.4% |
| Immigrants | Lebanon | 99.6 /100 | #71 | Exceptional 8.4% |
| Lithuanians | 99.6 /100 | #72 | Exceptional 8.4% |
| Poles | 99.6 /100 | #73 | Exceptional 8.4% |
| Cubans | 99.5 /100 | #74 | Exceptional 8.5% |
| Jordanians | 99.5 /100 | #75 | Exceptional 8.5% |
| Immigrants | Philippines | 99.5 /100 | #76 | Exceptional 8.5% |
Demographics Similar to Immigrants from Middle Africa by No Vehicles in Household
In terms of no vehicles in household, the demographic groups most similar to Immigrants from Middle Africa are New Zealander (10.2%, a difference of 0.10%), Immigrants from Austria (10.2%, a difference of 0.20%), Immigrants from Cambodia (10.2%, a difference of 0.31%), Immigrants from Indonesia (10.1%, a difference of 0.58%), and South African (10.2%, a difference of 0.68%).
| Demographics | Rating | Rank | No Vehicles in Household |
| Tlingit-Haida | 72.5 /100 | #153 | Good 10.1% |
| Sioux | 72.4 /100 | #154 | Good 10.1% |
| Salvadorans | 72.4 /100 | #155 | Good 10.1% |
| Immigrants | Micronesia | 70.9 /100 | #156 | Good 10.1% |
| Australians | 70.6 /100 | #157 | Good 10.1% |
| Spanish American Indians | 70.2 /100 | #158 | Good 10.1% |
| Immigrants | Indonesia | 69.3 /100 | #159 | Good 10.1% |
| Immigrants | Middle Africa | 65.7 /100 | #160 | Good 10.2% |
| New Zealanders | 65.1 /100 | #161 | Good 10.2% |
| Immigrants | Austria | 64.4 /100 | #162 | Good 10.2% |
| Immigrants | Cambodia | 63.7 /100 | #163 | Good 10.2% |
| South Africans | 61.1 /100 | #164 | Good 10.2% |
| Comanche | 60.8 /100 | #165 | Good 10.2% |
| Immigrants | Costa Rica | 60.5 /100 | #166 | Good 10.3% |
| Immigrants | Saudi Arabia | 58.8 /100 | #167 | Average 10.3% |