Spaniard vs Syrian 10th Grade
COMPARE
Spaniard
Syrian
10th Grade
10th Grade Comparison
Spaniards
Syrians
93.7%
10TH GRADE
50.3/ 100
METRIC RATING
173rd/ 347
METRIC RANK
94.5%
10TH GRADE
97.7/ 100
METRIC RATING
101st/ 347
METRIC RANK
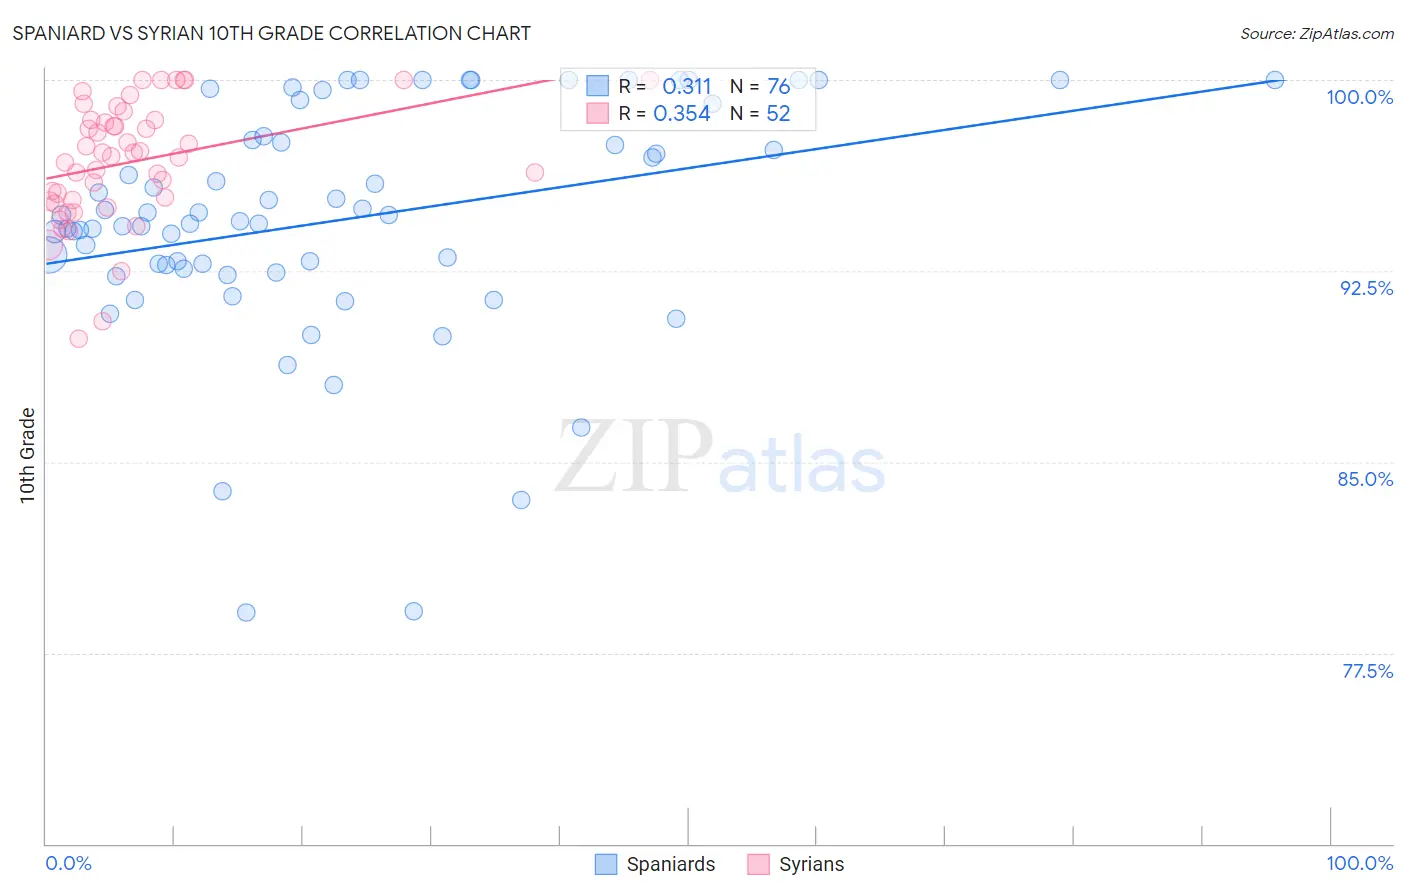
Spaniard vs Syrian 10th Grade Correlation Chart
The statistical analysis conducted on geographies consisting of 443,545,794 people shows a mild positive correlation between the proportion of Spaniards and percentage of population with at least 10th grade education in the United States with a correlation coefficient (R) of 0.311 and weighted average of 93.7%. Similarly, the statistical analysis conducted on geographies consisting of 266,305,988 people shows a mild positive correlation between the proportion of Syrians and percentage of population with at least 10th grade education in the United States with a correlation coefficient (R) of 0.354 and weighted average of 94.5%, a difference of 0.84%.
10th Grade Correlation Summary
| Measurement | Spaniard | Syrian |
| Minimum | 79.1% | 89.8% |
| Maximum | 100.0% | 100.0% |
| Range | 20.9% | 10.2% |
| Mean | 94.5% | 96.8% |
| Median | 94.6% | 97.1% |
| Interquartile 25% (IQ1) | 92.6% | 95.3% |
| Interquartile 75% (IQ3) | 97.7% | 98.4% |
| Interquartile Range (IQR) | 5.1% | 3.2% |
| Standard Deviation (Sample) | 4.6% | 2.4% |
| Standard Deviation (Population) | 4.6% | 2.3% |
Similar Demographics by 10th Grade
Demographics Similar to Spaniards by 10th Grade
In terms of 10th grade, the demographic groups most similar to Spaniards are Argentinean (93.7%, a difference of 0.0%), French American Indian (93.7%, a difference of 0.010%), Immigrants from Nepal (93.7%, a difference of 0.010%), Immigrants from Albania (93.8%, a difference of 0.020%), and Immigrants from Venezuela (93.8%, a difference of 0.030%).
| Demographics | Rating | Rank | 10th Grade |
| Immigrants | Iraq | 63.0 /100 | #166 | Good 93.8% |
| Immigrants | Egypt | 62.3 /100 | #167 | Good 93.8% |
| Alsatians | 59.4 /100 | #168 | Average 93.8% |
| Immigrants | Spain | 55.9 /100 | #169 | Average 93.8% |
| Immigrants | Venezuela | 53.9 /100 | #170 | Average 93.8% |
| Immigrants | Albania | 52.4 /100 | #171 | Average 93.8% |
| French American Indians | 50.9 /100 | #172 | Average 93.7% |
| Spaniards | 50.3 /100 | #173 | Average 93.7% |
| Argentineans | 50.0 /100 | #174 | Average 93.7% |
| Immigrants | Nepal | 49.6 /100 | #175 | Average 93.7% |
| Immigrants | Argentina | 47.1 /100 | #176 | Average 93.7% |
| Immigrants | Lebanon | 47.1 /100 | #177 | Average 93.7% |
| Sierra Leoneans | 46.1 /100 | #178 | Average 93.7% |
| Paraguayans | 45.3 /100 | #179 | Average 93.7% |
| Blackfeet | 42.8 /100 | #180 | Average 93.7% |
Demographics Similar to Syrians by 10th Grade
In terms of 10th grade, the demographic groups most similar to Syrians are Immigrants from South Central Asia (94.5%, a difference of 0.0%), Cambodian (94.5%, a difference of 0.010%), Immigrants from France (94.5%, a difference of 0.020%), Immigrants from Europe (94.5%, a difference of 0.020%), and Immigrants from Romania (94.5%, a difference of 0.020%).
| Demographics | Rating | Rank | 10th Grade |
| Immigrants | Germany | 98.3 /100 | #94 | Exceptional 94.6% |
| Menominee | 98.3 /100 | #95 | Exceptional 94.6% |
| Immigrants | Switzerland | 98.3 /100 | #96 | Exceptional 94.6% |
| Lebanese | 98.3 /100 | #97 | Exceptional 94.6% |
| Immigrants | Bulgaria | 98.1 /100 | #98 | Exceptional 94.6% |
| Immigrants | France | 97.9 /100 | #99 | Exceptional 94.5% |
| Immigrants | South Central Asia | 97.8 /100 | #100 | Exceptional 94.5% |
| Syrians | 97.7 /100 | #101 | Exceptional 94.5% |
| Cambodians | 97.6 /100 | #102 | Exceptional 94.5% |
| Immigrants | Europe | 97.5 /100 | #103 | Exceptional 94.5% |
| Immigrants | Romania | 97.5 /100 | #104 | Exceptional 94.5% |
| Immigrants | Turkey | 97.4 /100 | #105 | Exceptional 94.5% |
| Immigrants | Serbia | 97.4 /100 | #106 | Exceptional 94.5% |
| Immigrants | Croatia | 97.4 /100 | #107 | Exceptional 94.5% |
| Immigrants | North Macedonia | 97.2 /100 | #108 | Exceptional 94.5% |