Navajo vs Immigrants from Fiji 8th Grade
COMPARE
Navajo
Immigrants from Fiji
8th Grade
8th Grade Comparison
Navajo
Immigrants from Fiji
95.3%
8TH GRADE
5.7/ 100
METRIC RATING
226th/ 347
METRIC RANK
93.2%
8TH GRADE
0.0/ 100
METRIC RATING
320th/ 347
METRIC RANK
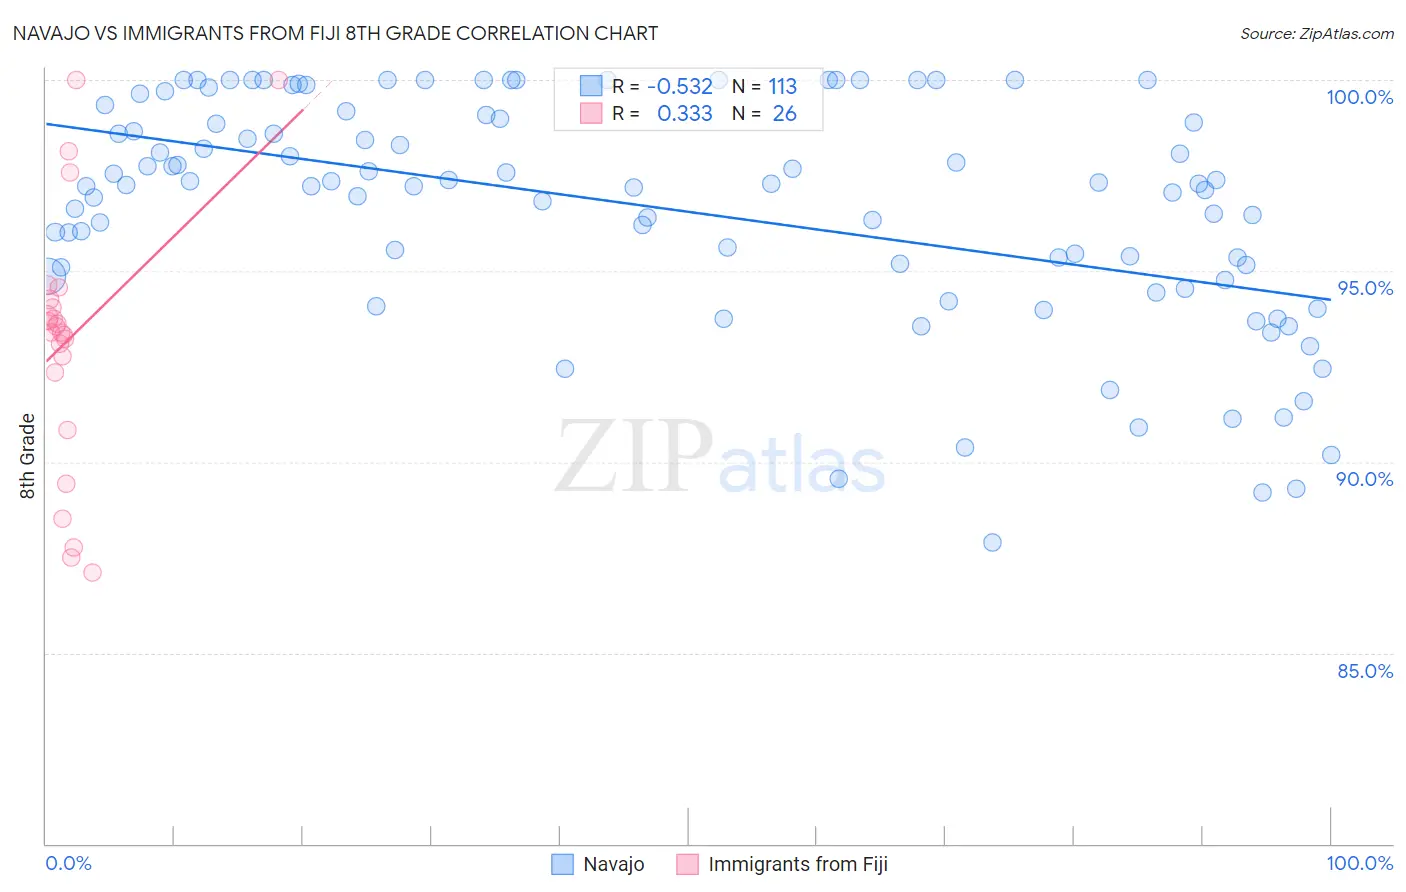
Navajo vs Immigrants from Fiji 8th Grade Correlation Chart
The statistical analysis conducted on geographies consisting of 224,871,905 people shows a substantial negative correlation between the proportion of Navajo and percentage of population with at least 8th grade education in the United States with a correlation coefficient (R) of -0.532 and weighted average of 95.3%. Similarly, the statistical analysis conducted on geographies consisting of 93,756,204 people shows a mild positive correlation between the proportion of Immigrants from Fiji and percentage of population with at least 8th grade education in the United States with a correlation coefficient (R) of 0.333 and weighted average of 93.2%, a difference of 2.3%.
8th Grade Correlation Summary
| Measurement | Navajo | Immigrants from Fiji |
| Minimum | 87.9% | 87.1% |
| Maximum | 100.0% | 100.0% |
| Range | 12.1% | 12.9% |
| Mean | 96.6% | 93.2% |
| Median | 97.3% | 93.5% |
| Interquartile 25% (IQ1) | 95.0% | 92.4% |
| Interquartile 75% (IQ3) | 99.0% | 94.3% |
| Interquartile Range (IQR) | 4.0% | 1.9% |
| Standard Deviation (Sample) | 2.9% | 3.4% |
| Standard Deviation (Population) | 2.9% | 3.3% |
Similar Demographics by 8th Grade
Demographics Similar to Navajo by 8th Grade
In terms of 8th grade, the demographic groups most similar to Navajo are Bahamian (95.3%, a difference of 0.0%), Immigrants from Western Asia (95.3%, a difference of 0.010%), Subsaharan African (95.3%, a difference of 0.010%), Immigrants from Eastern Africa (95.3%, a difference of 0.010%), and Immigrants from Malaysia (95.3%, a difference of 0.040%).
| Demographics | Rating | Rank | 8th Grade |
| Spanish Americans | 8.0 /100 | #219 | Tragic 95.4% |
| Immigrants | Southern Europe | 7.7 /100 | #220 | Tragic 95.3% |
| Immigrants | Syria | 7.4 /100 | #221 | Tragic 95.3% |
| Immigrants | Malaysia | 7.3 /100 | #222 | Tragic 95.3% |
| Immigrants | Oceania | 7.1 /100 | #223 | Tragic 95.3% |
| Immigrants | Western Asia | 6.0 /100 | #224 | Tragic 95.3% |
| Sub-Saharan Africans | 6.0 /100 | #225 | Tragic 95.3% |
| Navajo | 5.7 /100 | #226 | Tragic 95.3% |
| Bahamians | 5.6 /100 | #227 | Tragic 95.3% |
| Immigrants | Eastern Africa | 5.6 /100 | #228 | Tragic 95.3% |
| Immigrants | Indonesia | 4.4 /100 | #229 | Tragic 95.3% |
| Immigrants | Panama | 4.1 /100 | #230 | Tragic 95.2% |
| Asians | 3.5 /100 | #231 | Tragic 95.2% |
| Indians (Asian) | 3.3 /100 | #232 | Tragic 95.2% |
| Immigrants | Asia | 3.1 /100 | #233 | Tragic 95.2% |
Demographics Similar to Immigrants from Fiji by 8th Grade
In terms of 8th grade, the demographic groups most similar to Immigrants from Fiji are Immigrants from Cuba (93.2%, a difference of 0.030%), Puerto Rican (93.2%, a difference of 0.060%), Immigrants from Ecuador (93.3%, a difference of 0.070%), Immigrants from Cambodia (93.3%, a difference of 0.12%), and Belizean (93.1%, a difference of 0.13%).
| Demographics | Rating | Rank | 8th Grade |
| Immigrants | Caribbean | 0.0 /100 | #313 | Tragic 93.5% |
| Immigrants | Vietnam | 0.0 /100 | #314 | Tragic 93.5% |
| Vietnamese | 0.0 /100 | #315 | Tragic 93.5% |
| Immigrants | Cambodia | 0.0 /100 | #316 | Tragic 93.3% |
| Immigrants | Ecuador | 0.0 /100 | #317 | Tragic 93.3% |
| Puerto Ricans | 0.0 /100 | #318 | Tragic 93.2% |
| Immigrants | Cuba | 0.0 /100 | #319 | Tragic 93.2% |
| Immigrants | Fiji | 0.0 /100 | #320 | Tragic 93.2% |
| Belizeans | 0.0 /100 | #321 | Tragic 93.1% |
| Nicaraguans | 0.0 /100 | #322 | Tragic 93.0% |
| Immigrants | Belize | 0.0 /100 | #323 | Tragic 92.9% |
| Nepalese | 0.0 /100 | #324 | Tragic 92.8% |
| Dominicans | 0.0 /100 | #325 | Tragic 92.8% |
| Central American Indians | 0.0 /100 | #326 | Tragic 92.7% |
| Immigrants | Azores | 0.0 /100 | #327 | Tragic 92.5% |