Spaniard vs Immigrants from Ecuador Unemployment Among Ages 35 to 44 years
COMPARE
Spaniard
Immigrants from Ecuador
Unemployment Among Ages 35 to 44 years
Unemployment Among Ages 35 to 44 years Comparison
Spaniards
Immigrants from Ecuador
4.8%
UNEMPLOYMENT AMONG AGES 35 TO 44 YEARS
18.7/ 100
METRIC RATING
205th/ 347
METRIC RANK
5.4%
UNEMPLOYMENT AMONG AGES 35 TO 44 YEARS
0.0/ 100
METRIC RATING
283rd/ 347
METRIC RANK
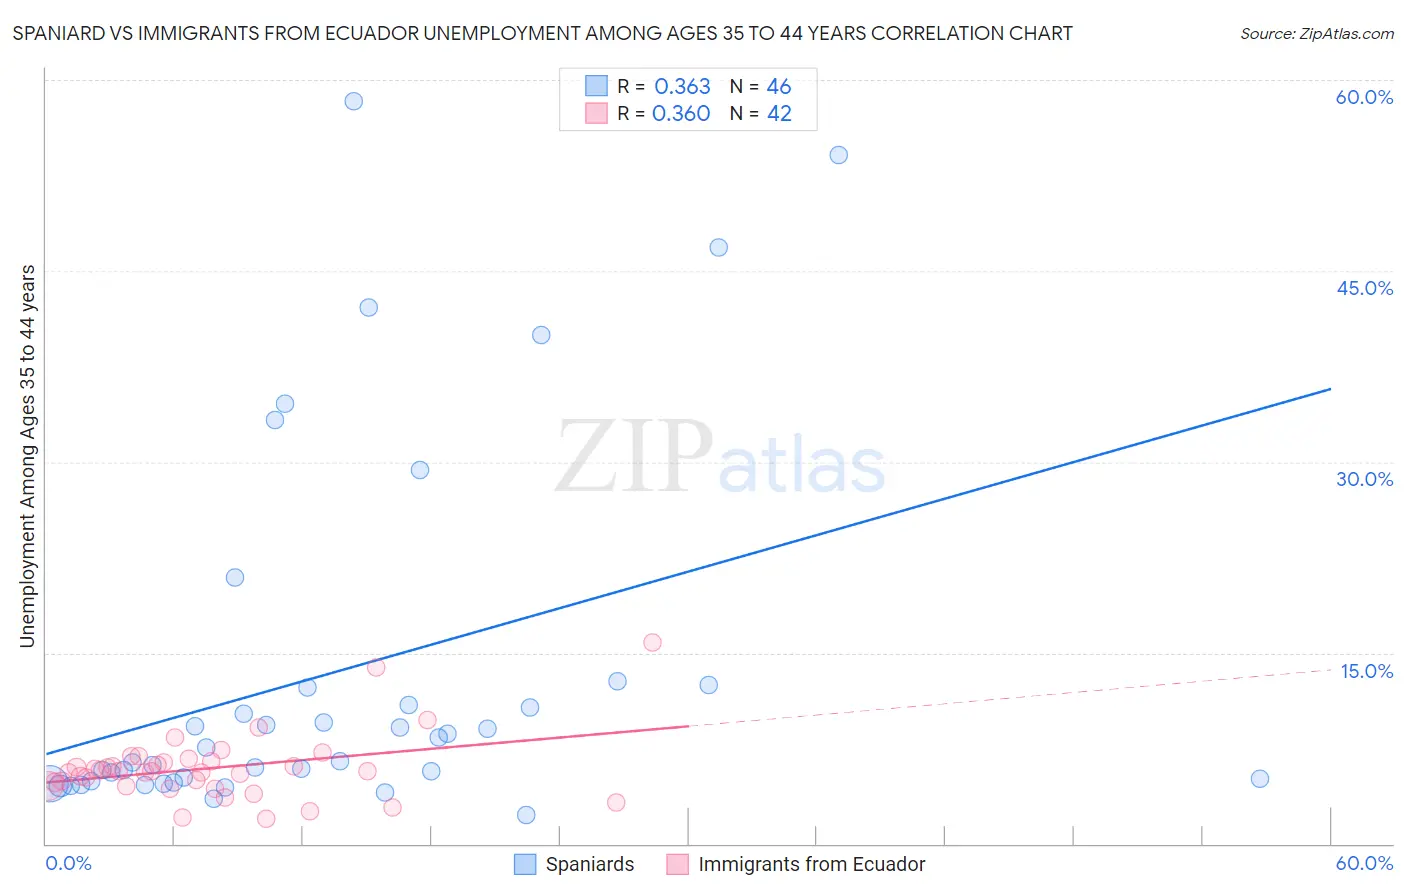
Spaniard vs Immigrants from Ecuador Unemployment Among Ages 35 to 44 years Correlation Chart
The statistical analysis conducted on geographies consisting of 431,052,510 people shows a mild positive correlation between the proportion of Spaniards and unemployment rate among population between the ages 35 and 44 in the United States with a correlation coefficient (R) of 0.363 and weighted average of 4.8%. Similarly, the statistical analysis conducted on geographies consisting of 267,738,021 people shows a mild positive correlation between the proportion of Immigrants from Ecuador and unemployment rate among population between the ages 35 and 44 in the United States with a correlation coefficient (R) of 0.360 and weighted average of 5.4%, a difference of 13.2%.
Unemployment Among Ages 35 to 44 years Correlation Summary
| Measurement | Spaniard | Immigrants from Ecuador |
| Minimum | 2.3% | 2.0% |
| Maximum | 58.3% | 15.8% |
| Range | 56.0% | 13.8% |
| Mean | 13.4% | 5.9% |
| Median | 7.0% | 5.7% |
| Interquartile 25% (IQ1) | 4.9% | 4.6% |
| Interquartile 75% (IQ3) | 12.2% | 6.5% |
| Interquartile Range (IQR) | 7.3% | 1.9% |
| Standard Deviation (Sample) | 14.4% | 2.6% |
| Standard Deviation (Population) | 14.2% | 2.6% |
Similar Demographics by Unemployment Among Ages 35 to 44 years
Demographics Similar to Spaniards by Unemployment Among Ages 35 to 44 years
In terms of unemployment among ages 35 to 44 years, the demographic groups most similar to Spaniards are Soviet Union (4.8%, a difference of 0.040%), Immigrants from Philippines (4.8%, a difference of 0.12%), Uruguayan (4.8%, a difference of 0.14%), Immigrants from Afghanistan (4.8%, a difference of 0.17%), and Immigrants from Western Asia (4.8%, a difference of 0.25%).
| Demographics | Rating | Rank | Unemployment Among Ages 35 to 44 years |
| Immigrants | Thailand | 22.9 /100 | #198 | Fair 4.8% |
| Immigrants | Middle Africa | 21.9 /100 | #199 | Fair 4.8% |
| Immigrants | Ukraine | 21.4 /100 | #200 | Fair 4.8% |
| Ugandans | 21.4 /100 | #201 | Fair 4.8% |
| Immigrants | Afghanistan | 20.2 /100 | #202 | Fair 4.8% |
| Uruguayans | 20.0 /100 | #203 | Fair 4.8% |
| Immigrants | Philippines | 19.8 /100 | #204 | Poor 4.8% |
| Spaniards | 18.7 /100 | #205 | Poor 4.8% |
| Soviet Union | 18.4 /100 | #206 | Poor 4.8% |
| Immigrants | Western Asia | 16.6 /100 | #207 | Poor 4.8% |
| French Canadians | 16.5 /100 | #208 | Poor 4.8% |
| Immigrants | Uruguay | 11.5 /100 | #209 | Poor 4.9% |
| Immigrants | Cameroon | 11.4 /100 | #210 | Poor 4.9% |
| Immigrants | Nonimmigrants | 9.4 /100 | #211 | Tragic 4.9% |
| Fijians | 8.7 /100 | #212 | Tragic 4.9% |
Demographics Similar to Immigrants from Ecuador by Unemployment Among Ages 35 to 44 years
In terms of unemployment among ages 35 to 44 years, the demographic groups most similar to Immigrants from Ecuador are Haitian (5.5%, a difference of 0.54%), Immigrants from Ghana (5.4%, a difference of 0.62%), Hispanic or Latino (5.5%, a difference of 0.70%), Immigrants from Micronesia (5.5%, a difference of 0.82%), and French American Indian (5.5%, a difference of 0.94%).
| Demographics | Rating | Rank | Unemployment Among Ages 35 to 44 years |
| Native Hawaiians | 0.0 /100 | #276 | Tragic 5.4% |
| Immigrants | Caribbean | 0.0 /100 | #277 | Tragic 5.4% |
| Lumbee | 0.0 /100 | #278 | Tragic 5.4% |
| Immigrants | Senegal | 0.0 /100 | #279 | Tragic 5.4% |
| Ecuadorians | 0.0 /100 | #280 | Tragic 5.4% |
| Immigrants | Portugal | 0.0 /100 | #281 | Tragic 5.4% |
| Immigrants | Ghana | 0.0 /100 | #282 | Tragic 5.4% |
| Immigrants | Ecuador | 0.0 /100 | #283 | Tragic 5.4% |
| Haitians | 0.0 /100 | #284 | Tragic 5.5% |
| Hispanics or Latinos | 0.0 /100 | #285 | Tragic 5.5% |
| Immigrants | Micronesia | 0.0 /100 | #286 | Tragic 5.5% |
| French American Indians | 0.0 /100 | #287 | Tragic 5.5% |
| Cree | 0.0 /100 | #288 | Tragic 5.5% |
| Spanish American Indians | 0.0 /100 | #289 | Tragic 5.5% |
| Jamaicans | 0.0 /100 | #290 | Tragic 5.5% |