Spaniard vs Marshallese High School Diploma
COMPARE
Spaniard
Marshallese
High School Diploma
High School Diploma Comparison
Spaniards
Marshallese
89.1%
HIGH SCHOOL DIPLOMA
43.4/ 100
METRIC RATING
182nd/ 347
METRIC RANK
88.6%
HIGH SCHOOL DIPLOMA
18.7/ 100
METRIC RATING
199th/ 347
METRIC RANK
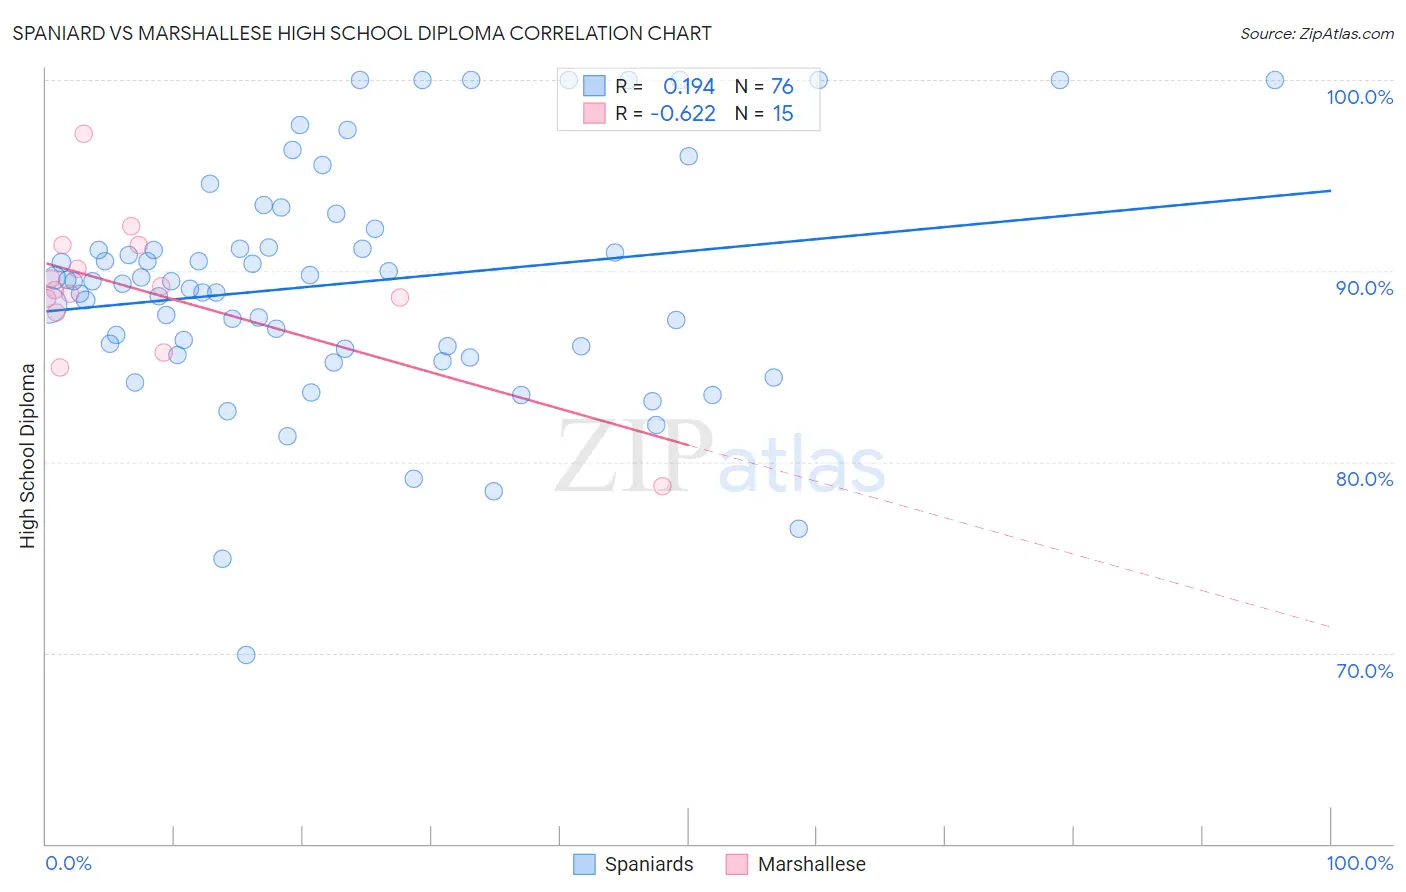
Spaniard vs Marshallese High School Diploma Correlation Chart
The statistical analysis conducted on geographies consisting of 443,545,794 people shows a poor positive correlation between the proportion of Spaniards and percentage of population with at least high school diploma education in the United States with a correlation coefficient (R) of 0.194 and weighted average of 89.1%. Similarly, the statistical analysis conducted on geographies consisting of 14,760,991 people shows a significant negative correlation between the proportion of Marshallese and percentage of population with at least high school diploma education in the United States with a correlation coefficient (R) of -0.622 and weighted average of 88.6%, a difference of 0.46%.
High School Diploma Correlation Summary
| Measurement | Spaniard | Marshallese |
| Minimum | 69.9% | 78.7% |
| Maximum | 100.0% | 97.2% |
| Range | 30.1% | 18.5% |
| Mean | 89.3% | 88.9% |
| Median | 89.5% | 89.0% |
| Interquartile 25% (IQ1) | 86.0% | 87.8% |
| Interquartile 75% (IQ3) | 91.7% | 91.3% |
| Interquartile Range (IQR) | 5.7% | 3.5% |
| Standard Deviation (Sample) | 6.2% | 4.0% |
| Standard Deviation (Population) | 6.1% | 3.9% |
Demographics Similar to Spaniards and Marshallese by High School Diploma
In terms of high school diploma, the demographic groups most similar to Spaniards are Venezuelan (89.1%, a difference of 0.0%), Potawatomi (89.0%, a difference of 0.010%), Bolivian (89.1%, a difference of 0.030%), Immigrants from Syria (89.0%, a difference of 0.060%), and Ethiopian (89.0%, a difference of 0.10%). Similarly, the demographic groups most similar to Marshallese are Liberian (88.7%, a difference of 0.0%), Hawaiian (88.6%, a difference of 0.010%), French American Indian (88.7%, a difference of 0.070%), Immigrants from Southern Europe (88.7%, a difference of 0.11%), and Afghan (88.8%, a difference of 0.12%).
| Demographics | Rating | Rank | High School Diploma |
| Bolivians | 45.2 /100 | #180 | Average 89.1% |
| Venezuelans | 43.6 /100 | #181 | Average 89.1% |
| Spaniards | 43.4 /100 | #182 | Average 89.1% |
| Potawatomi | 42.5 /100 | #183 | Average 89.0% |
| Immigrants | Syria | 39.2 /100 | #184 | Fair 89.0% |
| Ethiopians | 37.0 /100 | #185 | Fair 89.0% |
| Immigrants | Eastern Africa | 35.8 /100 | #186 | Fair 88.9% |
| Guamanians/Chamorros | 35.5 /100 | #187 | Fair 88.9% |
| Immigrants | Sudan | 33.4 /100 | #188 | Fair 88.9% |
| Immigrants | Uganda | 32.6 /100 | #189 | Fair 88.9% |
| Immigrants | Chile | 31.9 /100 | #190 | Fair 88.9% |
| Immigrants | Ethiopia | 30.9 /100 | #191 | Fair 88.9% |
| Moroccans | 29.5 /100 | #192 | Fair 88.8% |
| Immigrants | Oceania | 26.9 /100 | #193 | Fair 88.8% |
| Immigrants | Venezuela | 25.8 /100 | #194 | Fair 88.8% |
| Afghans | 23.9 /100 | #195 | Fair 88.8% |
| Immigrants | Southern Europe | 23.4 /100 | #196 | Fair 88.7% |
| French American Indians | 21.5 /100 | #197 | Fair 88.7% |
| Liberians | 18.8 /100 | #198 | Poor 88.7% |
| Marshallese | 18.7 /100 | #199 | Poor 88.6% |
| Hawaiians | 18.3 /100 | #200 | Poor 88.6% |