Spaniard vs Syrian High School Diploma
COMPARE
Spaniard
Syrian
High School Diploma
High School Diploma Comparison
Spaniards
Syrians
89.1%
HIGH SCHOOL DIPLOMA
43.4/ 100
METRIC RATING
182nd/ 347
METRIC RANK
90.3%
HIGH SCHOOL DIPLOMA
97.0/ 100
METRIC RATING
106th/ 347
METRIC RANK
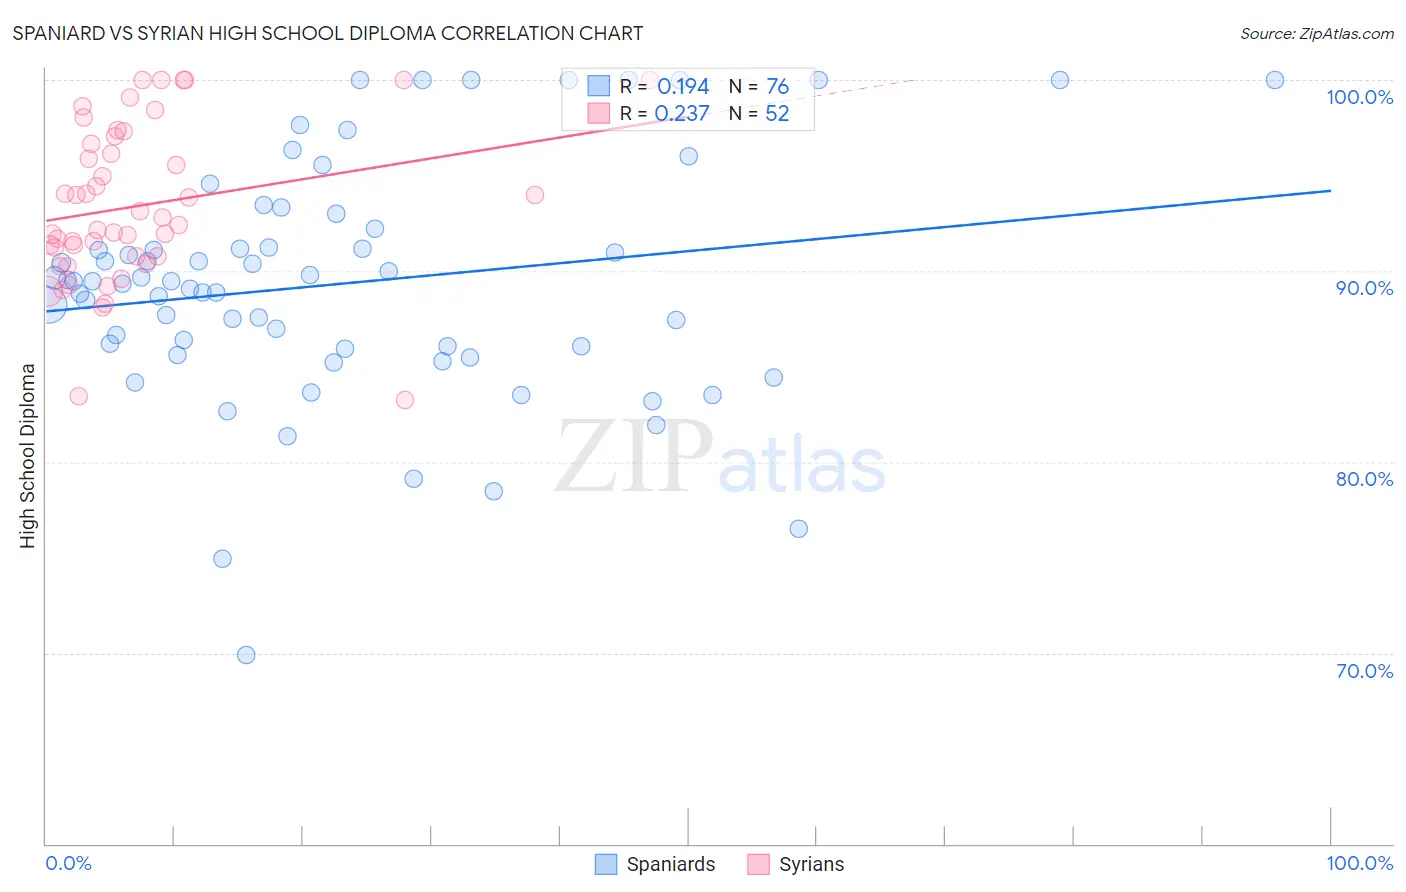
Spaniard vs Syrian High School Diploma Correlation Chart
The statistical analysis conducted on geographies consisting of 443,545,794 people shows a poor positive correlation between the proportion of Spaniards and percentage of population with at least high school diploma education in the United States with a correlation coefficient (R) of 0.194 and weighted average of 89.1%. Similarly, the statistical analysis conducted on geographies consisting of 266,306,452 people shows a weak positive correlation between the proportion of Syrians and percentage of population with at least high school diploma education in the United States with a correlation coefficient (R) of 0.237 and weighted average of 90.3%, a difference of 1.4%.
High School Diploma Correlation Summary
| Measurement | Spaniard | Syrian |
| Minimum | 69.9% | 83.2% |
| Maximum | 100.0% | 100.0% |
| Range | 30.1% | 16.8% |
| Mean | 89.3% | 93.4% |
| Median | 89.5% | 92.6% |
| Interquartile 25% (IQ1) | 86.0% | 90.8% |
| Interquartile 75% (IQ3) | 91.7% | 96.9% |
| Interquartile Range (IQR) | 5.7% | 6.1% |
| Standard Deviation (Sample) | 6.2% | 4.1% |
| Standard Deviation (Population) | 6.1% | 4.1% |
Similar Demographics by High School Diploma
Demographics Similar to Spaniards by High School Diploma
In terms of high school diploma, the demographic groups most similar to Spaniards are Venezuelan (89.1%, a difference of 0.0%), Potawatomi (89.0%, a difference of 0.010%), Bolivian (89.1%, a difference of 0.030%), American (89.1%, a difference of 0.060%), and Immigrants from Syria (89.0%, a difference of 0.060%).
| Demographics | Rating | Rank | High School Diploma |
| Immigrants | Western Asia | 49.0 /100 | #175 | Average 89.1% |
| Osage | 48.9 /100 | #176 | Average 89.1% |
| Sudanese | 48.5 /100 | #177 | Average 89.1% |
| Sierra Leoneans | 48.4 /100 | #178 | Average 89.1% |
| Americans | 47.2 /100 | #179 | Average 89.1% |
| Bolivians | 45.2 /100 | #180 | Average 89.1% |
| Venezuelans | 43.6 /100 | #181 | Average 89.1% |
| Spaniards | 43.4 /100 | #182 | Average 89.1% |
| Potawatomi | 42.5 /100 | #183 | Average 89.0% |
| Immigrants | Syria | 39.2 /100 | #184 | Fair 89.0% |
| Ethiopians | 37.0 /100 | #185 | Fair 89.0% |
| Immigrants | Eastern Africa | 35.8 /100 | #186 | Fair 88.9% |
| Guamanians/Chamorros | 35.5 /100 | #187 | Fair 88.9% |
| Immigrants | Sudan | 33.4 /100 | #188 | Fair 88.9% |
| Immigrants | Uganda | 32.6 /100 | #189 | Fair 88.9% |
Demographics Similar to Syrians by High School Diploma
In terms of high school diploma, the demographic groups most similar to Syrians are Immigrants from Russia (90.3%, a difference of 0.020%), Palestinian (90.3%, a difference of 0.030%), Immigrants from Zimbabwe (90.3%, a difference of 0.030%), Lebanese (90.4%, a difference of 0.050%), and Immigrants from Greece (90.3%, a difference of 0.050%).
| Demographics | Rating | Rank | High School Diploma |
| Immigrants | Europe | 98.2 /100 | #99 | Exceptional 90.5% |
| Immigrants | North Macedonia | 98.1 /100 | #100 | Exceptional 90.5% |
| Immigrants | Norway | 98.0 /100 | #101 | Exceptional 90.5% |
| Aleuts | 98.0 /100 | #102 | Exceptional 90.4% |
| Immigrants | Romania | 97.8 /100 | #103 | Exceptional 90.4% |
| Immigrants | Croatia | 97.8 /100 | #104 | Exceptional 90.4% |
| Lebanese | 97.4 /100 | #105 | Exceptional 90.4% |
| Syrians | 97.0 /100 | #106 | Exceptional 90.3% |
| Immigrants | Russia | 96.9 /100 | #107 | Exceptional 90.3% |
| Palestinians | 96.7 /100 | #108 | Exceptional 90.3% |
| Immigrants | Zimbabwe | 96.7 /100 | #109 | Exceptional 90.3% |
| Immigrants | Greece | 96.6 /100 | #110 | Exceptional 90.3% |
| Menominee | 96.6 /100 | #111 | Exceptional 90.3% |
| Immigrants | Belarus | 96.4 /100 | #112 | Exceptional 90.2% |
| Immigrants | Sri Lanka | 96.3 /100 | #113 | Exceptional 90.2% |