Okinawan vs Immigrants from Costa Rica Bachelor's Degree
COMPARE
Okinawan
Immigrants from Costa Rica
Bachelor's Degree
Bachelor's Degree Comparison
Okinawans
Immigrants from Costa Rica
50.5%
BACHELOR'S DEGREE
100.0/ 100
METRIC RATING
6th/ 347
METRIC RANK
36.9%
BACHELOR'S DEGREE
27.4/ 100
METRIC RATING
199th/ 347
METRIC RANK
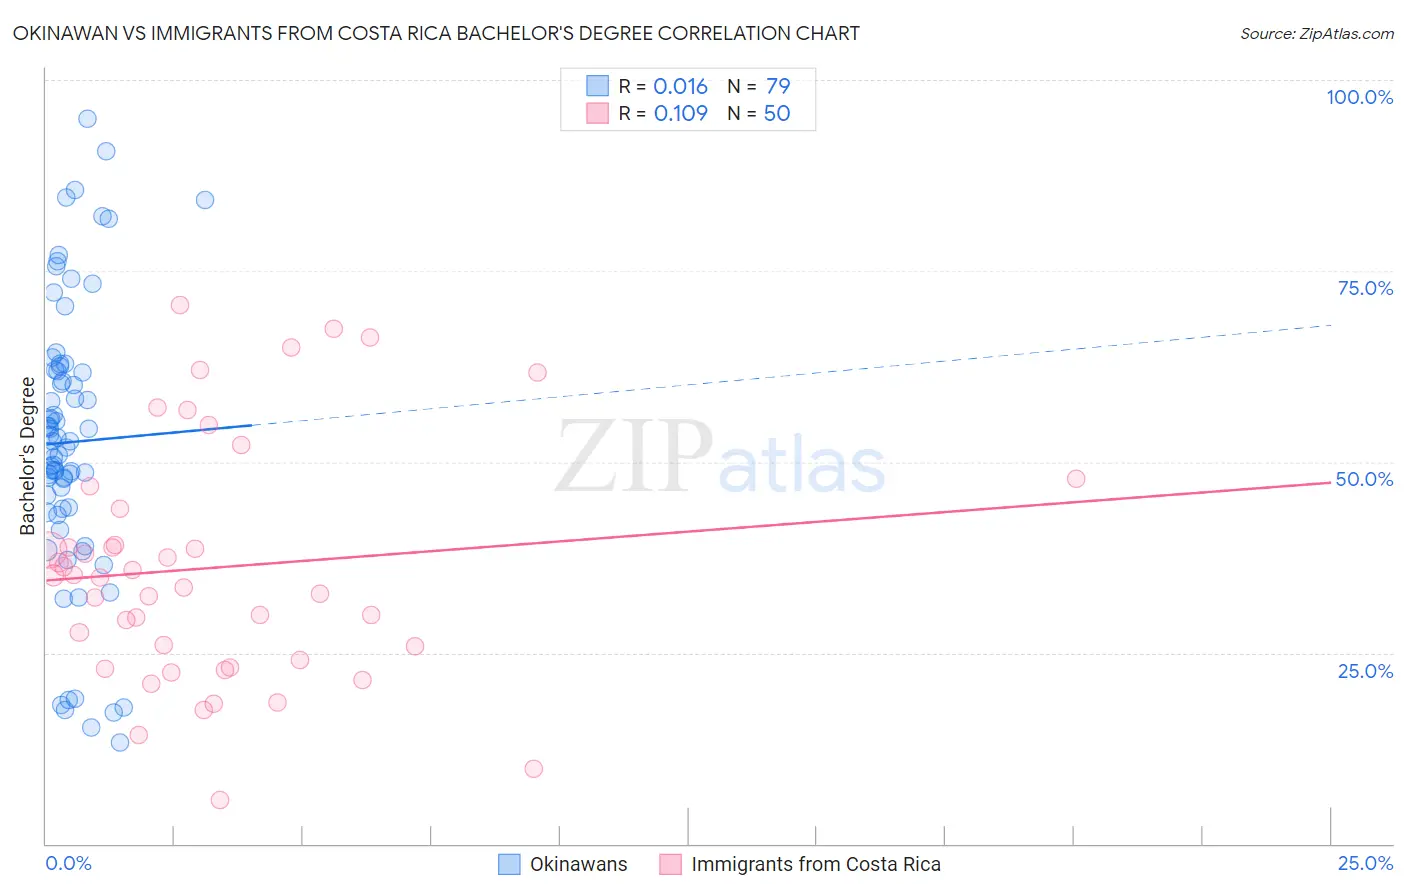
Okinawan vs Immigrants from Costa Rica Bachelor's Degree Correlation Chart
The statistical analysis conducted on geographies consisting of 73,779,368 people shows no correlation between the proportion of Okinawans and percentage of population with at least bachelor's degree education in the United States with a correlation coefficient (R) of 0.016 and weighted average of 50.5%. Similarly, the statistical analysis conducted on geographies consisting of 204,273,479 people shows a poor positive correlation between the proportion of Immigrants from Costa Rica and percentage of population with at least bachelor's degree education in the United States with a correlation coefficient (R) of 0.109 and weighted average of 36.9%, a difference of 36.9%.
Bachelor's Degree Correlation Summary
| Measurement | Okinawan | Immigrants from Costa Rica |
| Minimum | 13.3% | 5.7% |
| Maximum | 95.0% | 70.5% |
| Range | 81.7% | 64.7% |
| Mean | 52.6% | 36.1% |
| Median | 52.8% | 35.0% |
| Interquartile 25% (IQ1) | 43.9% | 24.1% |
| Interquartile 75% (IQ3) | 62.1% | 43.8% |
| Interquartile Range (IQR) | 18.2% | 19.7% |
| Standard Deviation (Sample) | 18.1% | 15.6% |
| Standard Deviation (Population) | 18.0% | 15.4% |
Similar Demographics by Bachelor's Degree
Demographics Similar to Okinawans by Bachelor's Degree
In terms of bachelor's degree, the demographic groups most similar to Okinawans are Immigrants from Iran (50.3%, a difference of 0.48%), Iranian (51.0%, a difference of 0.84%), Thai (50.1%, a difference of 0.85%), Immigrants from Israel (50.0%, a difference of 1.1%), and Immigrants from Taiwan (51.2%, a difference of 1.3%).
| Demographics | Rating | Rank | Bachelor's Degree |
| Filipinos | 100.0 /100 | #1 | Exceptional 52.7% |
| Immigrants | Singapore | 100.0 /100 | #2 | Exceptional 51.9% |
| Immigrants | India | 100.0 /100 | #3 | Exceptional 51.3% |
| Immigrants | Taiwan | 100.0 /100 | #4 | Exceptional 51.2% |
| Iranians | 100.0 /100 | #5 | Exceptional 51.0% |
| Okinawans | 100.0 /100 | #6 | Exceptional 50.5% |
| Immigrants | Iran | 100.0 /100 | #7 | Exceptional 50.3% |
| Thais | 100.0 /100 | #8 | Exceptional 50.1% |
| Immigrants | Israel | 100.0 /100 | #9 | Exceptional 50.0% |
| Cypriots | 100.0 /100 | #10 | Exceptional 49.0% |
| Immigrants | Australia | 100.0 /100 | #11 | Exceptional 48.5% |
| Immigrants | China | 100.0 /100 | #12 | Exceptional 48.4% |
| Immigrants | South Central Asia | 100.0 /100 | #13 | Exceptional 48.3% |
| Immigrants | Hong Kong | 100.0 /100 | #14 | Exceptional 48.2% |
| Immigrants | Eastern Asia | 100.0 /100 | #15 | Exceptional 48.1% |
Demographics Similar to Immigrants from Costa Rica by Bachelor's Degree
In terms of bachelor's degree, the demographic groups most similar to Immigrants from Costa Rica are Immigrants from Ghana (36.9%, a difference of 0.0%), Welsh (37.0%, a difference of 0.21%), Czechoslovakian (37.0%, a difference of 0.22%), Celtic (37.0%, a difference of 0.26%), and Immigrants from South Eastern Asia (36.8%, a difference of 0.26%).
| Demographics | Rating | Rank | Bachelor's Degree |
| Immigrants | Vietnam | 32.1 /100 | #192 | Fair 37.1% |
| Yugoslavians | 31.5 /100 | #193 | Fair 37.1% |
| Belgians | 29.9 /100 | #194 | Fair 37.0% |
| Koreans | 29.8 /100 | #195 | Fair 37.0% |
| Celtics | 29.5 /100 | #196 | Fair 37.0% |
| Czechoslovakians | 29.2 /100 | #197 | Fair 37.0% |
| Welsh | 29.1 /100 | #198 | Fair 37.0% |
| Immigrants | Costa Rica | 27.4 /100 | #199 | Fair 36.9% |
| Immigrants | Ghana | 27.4 /100 | #200 | Fair 36.9% |
| Immigrants | South Eastern Asia | 25.4 /100 | #201 | Fair 36.8% |
| Immigrants | Zaire | 25.3 /100 | #202 | Fair 36.8% |
| Immigrants | Nigeria | 23.1 /100 | #203 | Fair 36.7% |
| Immigrants | Immigrants | 22.8 /100 | #204 | Fair 36.7% |
| Finns | 22.2 /100 | #205 | Fair 36.7% |
| Spaniards | 21.2 /100 | #206 | Fair 36.6% |