Israeli vs Immigrants from Chile Bachelor's Degree
COMPARE
Israeli
Immigrants from Chile
Bachelor's Degree
Bachelor's Degree Comparison
Israelis
Immigrants from Chile
46.1%
BACHELOR'S DEGREE
100.0/ 100
METRIC RATING
29th/ 347
METRIC RANK
40.8%
BACHELOR'S DEGREE
96.4/ 100
METRIC RATING
111th/ 347
METRIC RANK
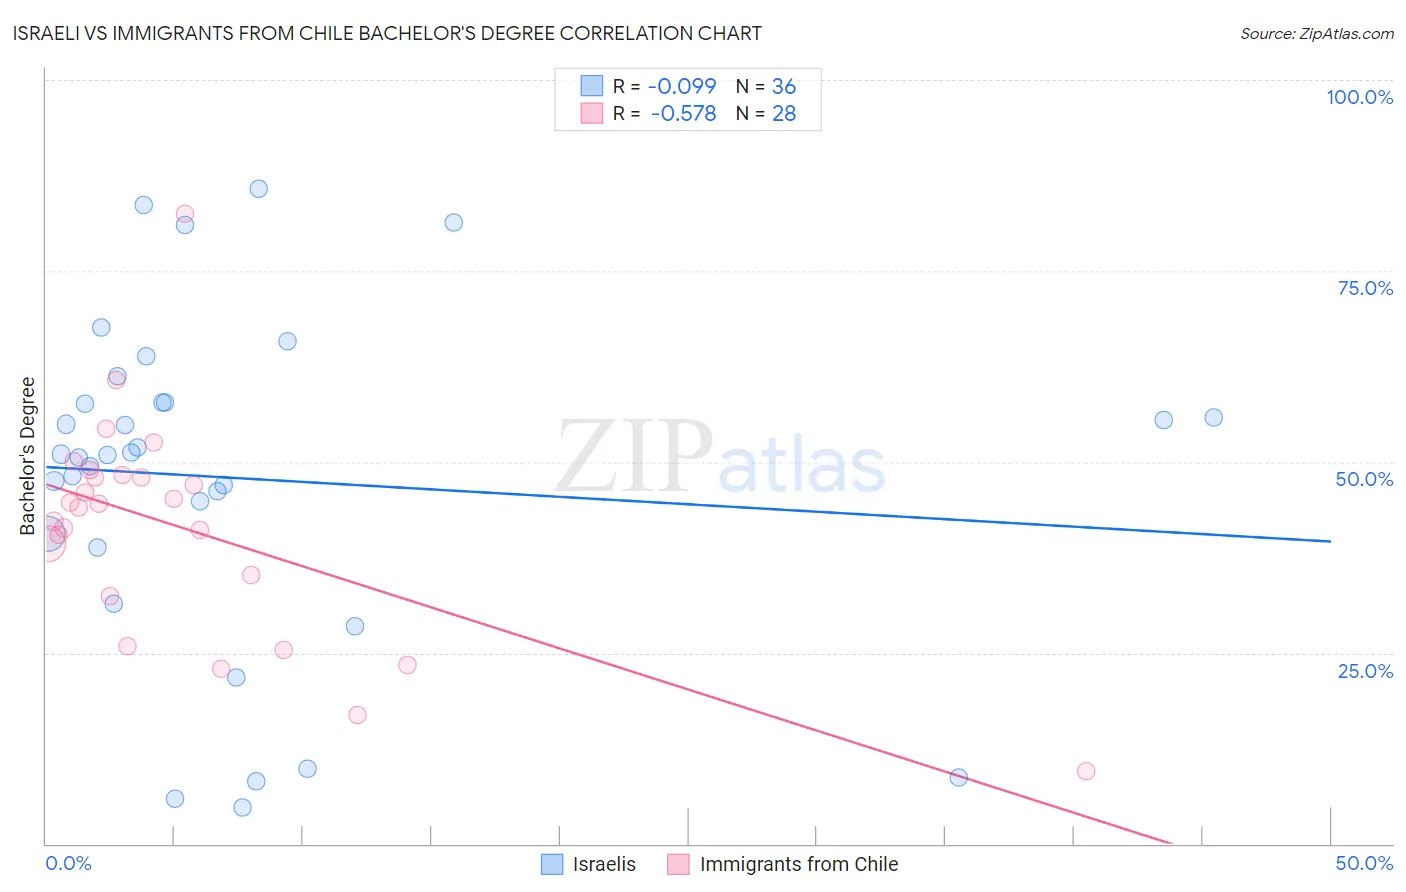
Israeli vs Immigrants from Chile Bachelor's Degree Correlation Chart
The statistical analysis conducted on geographies consisting of 211,181,200 people shows a slight negative correlation between the proportion of Israelis and percentage of population with at least bachelor's degree education in the United States with a correlation coefficient (R) of -0.099 and weighted average of 46.1%. Similarly, the statistical analysis conducted on geographies consisting of 218,646,599 people shows a substantial negative correlation between the proportion of Immigrants from Chile and percentage of population with at least bachelor's degree education in the United States with a correlation coefficient (R) of -0.578 and weighted average of 40.8%, a difference of 12.9%.
Bachelor's Degree Correlation Summary
| Measurement | Israeli | Immigrants from Chile |
| Minimum | 4.8% | 9.5% |
| Maximum | 85.8% | 82.5% |
| Range | 80.9% | 72.9% |
| Mean | 47.8% | 41.4% |
| Median | 51.0% | 44.3% |
| Interquartile 25% (IQ1) | 39.7% | 33.8% |
| Interquartile 75% (IQ3) | 57.8% | 48.1% |
| Interquartile Range (IQR) | 18.1% | 14.3% |
| Standard Deviation (Sample) | 21.6% | 14.4% |
| Standard Deviation (Population) | 21.3% | 14.2% |
Similar Demographics by Bachelor's Degree
Demographics Similar to Israelis by Bachelor's Degree
In terms of bachelor's degree, the demographic groups most similar to Israelis are Immigrants from Sri Lanka (46.1%, a difference of 0.050%), Latvian (46.1%, a difference of 0.090%), Turkish (46.2%, a difference of 0.13%), Immigrants from Turkey (46.0%, a difference of 0.39%), and Immigrants from France (46.4%, a difference of 0.59%).
| Demographics | Rating | Rank | Bachelor's Degree |
| Immigrants | Belgium | 100.0 /100 | #22 | Exceptional 47.0% |
| Immigrants | Sweden | 100.0 /100 | #23 | Exceptional 47.0% |
| Immigrants | Korea | 100.0 /100 | #24 | Exceptional 47.0% |
| Burmese | 100.0 /100 | #25 | Exceptional 46.9% |
| Immigrants | Japan | 100.0 /100 | #26 | Exceptional 46.8% |
| Immigrants | France | 100.0 /100 | #27 | Exceptional 46.4% |
| Turks | 100.0 /100 | #28 | Exceptional 46.2% |
| Israelis | 100.0 /100 | #29 | Exceptional 46.1% |
| Immigrants | Sri Lanka | 100.0 /100 | #30 | Exceptional 46.1% |
| Latvians | 100.0 /100 | #31 | Exceptional 46.1% |
| Immigrants | Turkey | 100.0 /100 | #32 | Exceptional 46.0% |
| Immigrants | Northern Europe | 100.0 /100 | #33 | Exceptional 45.6% |
| Immigrants | Denmark | 100.0 /100 | #34 | Exceptional 45.4% |
| Immigrants | Russia | 100.0 /100 | #35 | Exceptional 45.4% |
| Mongolians | 100.0 /100 | #36 | Exceptional 45.4% |
Demographics Similar to Immigrants from Chile by Bachelor's Degree
In terms of bachelor's degree, the demographic groups most similar to Immigrants from Chile are Albanian (40.9%, a difference of 0.050%), Ugandan (40.8%, a difference of 0.050%), Brazilian (40.8%, a difference of 0.090%), Arab (40.9%, a difference of 0.12%), and Afghan (40.8%, a difference of 0.12%).
| Demographics | Rating | Rank | Bachelor's Degree |
| Jordanians | 97.4 /100 | #104 | Exceptional 41.2% |
| Syrians | 97.4 /100 | #105 | Exceptional 41.1% |
| Alsatians | 97.0 /100 | #106 | Exceptional 41.0% |
| Northern Europeans | 96.8 /100 | #107 | Exceptional 41.0% |
| Ukrainians | 96.6 /100 | #108 | Exceptional 40.9% |
| Arabs | 96.6 /100 | #109 | Exceptional 40.9% |
| Albanians | 96.5 /100 | #110 | Exceptional 40.9% |
| Immigrants | Chile | 96.4 /100 | #111 | Exceptional 40.8% |
| Ugandans | 96.3 /100 | #112 | Exceptional 40.8% |
| Brazilians | 96.3 /100 | #113 | Exceptional 40.8% |
| Afghans | 96.2 /100 | #114 | Exceptional 40.8% |
| Palestinians | 95.8 /100 | #115 | Exceptional 40.7% |
| Immigrants | Uganda | 95.7 /100 | #116 | Exceptional 40.7% |
| Austrians | 95.5 /100 | #117 | Exceptional 40.6% |
| Croatians | 95.5 /100 | #118 | Exceptional 40.6% |