Spaniard vs Afghan Male Unemployment
COMPARE
Spaniard
Afghan
Male Unemployment
Male Unemployment Comparison
Spaniards
Afghans
5.3%
MALE UNEMPLOYMENT
35.1/ 100
METRIC RATING
184th/ 347
METRIC RANK
5.3%
MALE UNEMPLOYMENT
62.0/ 100
METRIC RATING
164th/ 347
METRIC RANK
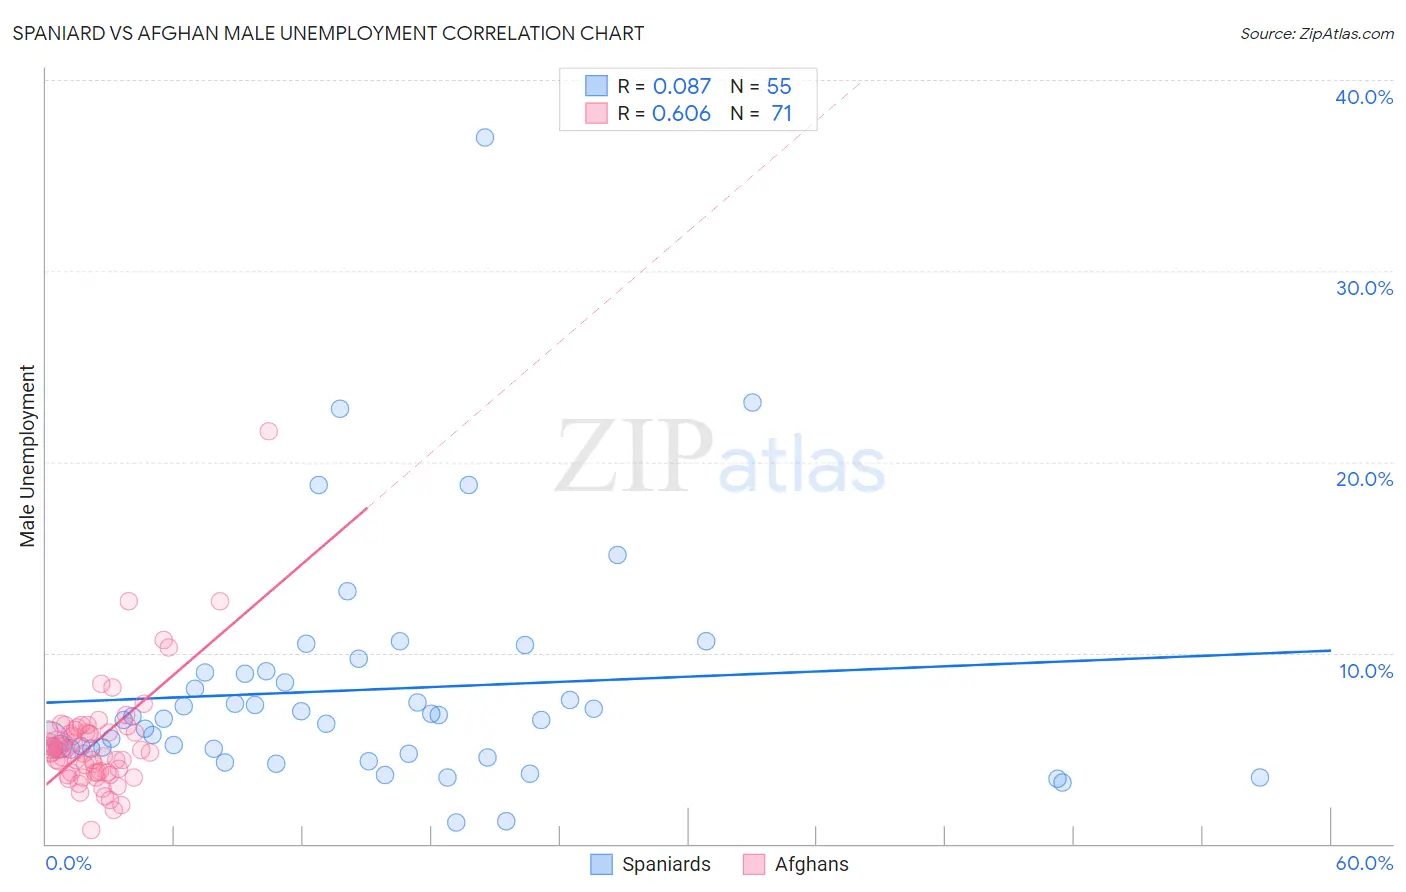
Spaniard vs Afghan Male Unemployment Correlation Chart
The statistical analysis conducted on geographies consisting of 441,055,878 people shows a slight positive correlation between the proportion of Spaniards and unemployment rate among males in the United States with a correlation coefficient (R) of 0.087 and weighted average of 5.3%. Similarly, the statistical analysis conducted on geographies consisting of 148,819,810 people shows a significant positive correlation between the proportion of Afghans and unemployment rate among males in the United States with a correlation coefficient (R) of 0.606 and weighted average of 5.3%, a difference of 1.6%.
Male Unemployment Correlation Summary
| Measurement | Spaniard | Afghan |
| Minimum | 1.1% | 0.70% |
| Maximum | 37.0% | 21.6% |
| Range | 35.9% | 20.9% |
| Mean | 8.1% | 5.3% |
| Median | 6.6% | 4.9% |
| Interquartile 25% (IQ1) | 5.0% | 3.7% |
| Interquartile 75% (IQ3) | 8.9% | 5.9% |
| Interquartile Range (IQR) | 4.0% | 2.1% |
| Standard Deviation (Sample) | 6.1% | 2.9% |
| Standard Deviation (Population) | 6.0% | 2.9% |
Demographics Similar to Spaniards and Afghans by Male Unemployment
In terms of male unemployment, the demographic groups most similar to Spaniards are Taiwanese (5.3%, a difference of 0.16%), Potawatomi (5.3%, a difference of 0.17%), Immigrants from Afghanistan (5.3%, a difference of 0.18%), Malaysian (5.3%, a difference of 0.28%), and Immigrants from Oceania (5.3%, a difference of 0.36%). Similarly, the demographic groups most similar to Afghans are South American (5.3%, a difference of 0.080%), Immigrants from Morocco (5.3%, a difference of 0.11%), Immigrants from Vietnam (5.3%, a difference of 0.23%), Immigrants from Ireland (5.3%, a difference of 0.26%), and Immigrants from Congo (5.3%, a difference of 0.28%).
| Demographics | Rating | Rank | Male Unemployment |
| Afghans | 62.0 /100 | #164 | Good 5.3% |
| South Americans | 60.6 /100 | #165 | Good 5.3% |
| Immigrants | Morocco | 60.2 /100 | #166 | Good 5.3% |
| Immigrants | Vietnam | 58.1 /100 | #167 | Average 5.3% |
| Immigrants | Ireland | 57.7 /100 | #168 | Average 5.3% |
| Immigrants | Congo | 57.4 /100 | #169 | Average 5.3% |
| Immigrants | Eastern Europe | 54.1 /100 | #170 | Average 5.3% |
| Peruvians | 51.9 /100 | #171 | Average 5.3% |
| Immigrants | Kazakhstan | 50.8 /100 | #172 | Average 5.3% |
| Immigrants | Russia | 50.7 /100 | #173 | Average 5.3% |
| Immigrants | Iran | 50.0 /100 | #174 | Average 5.3% |
| Immigrants | Iraq | 48.1 /100 | #175 | Average 5.3% |
| Immigrants | Poland | 46.0 /100 | #176 | Average 5.3% |
| Immigrants | Peru | 44.6 /100 | #177 | Average 5.3% |
| Osage | 42.5 /100 | #178 | Average 5.3% |
| Immigrants | Oceania | 40.8 /100 | #179 | Average 5.3% |
| Malaysians | 39.6 /100 | #180 | Fair 5.3% |
| Immigrants | Afghanistan | 37.9 /100 | #181 | Fair 5.3% |
| Potawatomi | 37.8 /100 | #182 | Fair 5.3% |
| Taiwanese | 37.6 /100 | #183 | Fair 5.3% |
| Spaniards | 35.1 /100 | #184 | Fair 5.3% |