Soviet Union vs Kiowa College, 1 year or more
COMPARE
Soviet Union
Kiowa
College, 1 year or more
College, 1 year or more Comparison
Soviet Union
Kiowa
66.4%
COLLEGE, 1 YEAR OR MORE
100.0/ 100
METRIC RATING
22nd/ 347
METRIC RANK
51.0%
COLLEGE, 1 YEAR OR MORE
0.0/ 100
METRIC RATING
320th/ 347
METRIC RANK
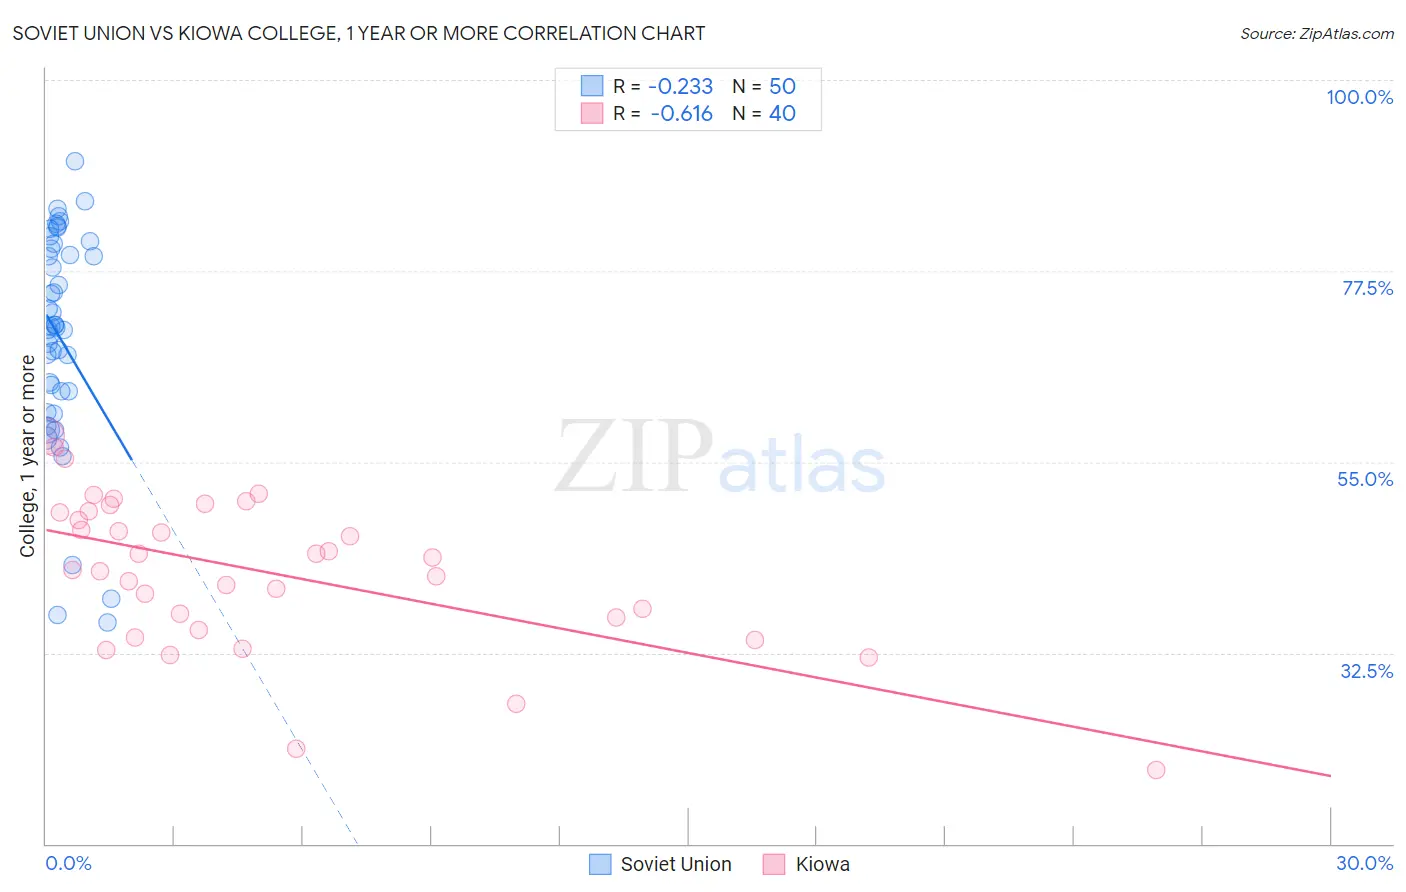
Soviet Union vs Kiowa College, 1 year or more Correlation Chart
The statistical analysis conducted on geographies consisting of 43,514,626 people shows a weak negative correlation between the proportion of Soviet Union and percentage of population with at least college, 1 year or more education in the United States with a correlation coefficient (R) of -0.233 and weighted average of 66.4%. Similarly, the statistical analysis conducted on geographies consisting of 56,101,444 people shows a significant negative correlation between the proportion of Kiowa and percentage of population with at least college, 1 year or more education in the United States with a correlation coefficient (R) of -0.616 and weighted average of 51.0%, a difference of 30.3%.
College, 1 year or more Correlation Summary
| Measurement | Soviet Union | Kiowa |
| Minimum | 36.1% | 18.8% |
| Maximum | 90.4% | 58.1% |
| Range | 54.3% | 39.3% |
| Mean | 69.7% | 42.0% |
| Median | 70.9% | 43.0% |
| Interquartile 25% (IQ1) | 63.3% | 35.9% |
| Interquartile 75% (IQ3) | 80.2% | 49.1% |
| Interquartile Range (IQR) | 16.9% | 13.2% |
| Standard Deviation (Sample) | 12.8% | 9.0% |
| Standard Deviation (Population) | 12.6% | 8.9% |
Similar Demographics by College, 1 year or more
Demographics Similar to Soviet Union by College, 1 year or more
In terms of college, 1 year or more, the demographic groups most similar to Soviet Union are Immigrants from Hong Kong (66.4%, a difference of 0.060%), Immigrants from China (66.4%, a difference of 0.060%), Immigrants from Korea (66.5%, a difference of 0.13%), Immigrants from Belgium (66.3%, a difference of 0.14%), and Immigrants from Switzerland (66.5%, a difference of 0.17%).
| Demographics | Rating | Rank | College, 1 year or more |
| Cambodians | 100.0 /100 | #15 | Exceptional 66.7% |
| Immigrants | Japan | 100.0 /100 | #16 | Exceptional 66.7% |
| Immigrants | Eastern Asia | 100.0 /100 | #17 | Exceptional 66.6% |
| Eastern Europeans | 100.0 /100 | #18 | Exceptional 66.6% |
| Immigrants | Switzerland | 100.0 /100 | #19 | Exceptional 66.5% |
| Immigrants | Korea | 100.0 /100 | #20 | Exceptional 66.5% |
| Immigrants | Hong Kong | 100.0 /100 | #21 | Exceptional 66.4% |
| Soviet Union | 100.0 /100 | #22 | Exceptional 66.4% |
| Immigrants | China | 100.0 /100 | #23 | Exceptional 66.4% |
| Immigrants | Belgium | 100.0 /100 | #24 | Exceptional 66.3% |
| Indians (Asian) | 100.0 /100 | #25 | Exceptional 66.1% |
| Latvians | 100.0 /100 | #26 | Exceptional 66.1% |
| Immigrants | Ireland | 100.0 /100 | #27 | Exceptional 65.9% |
| Immigrants | France | 100.0 /100 | #28 | Exceptional 65.8% |
| Immigrants | Northern Europe | 100.0 /100 | #29 | Exceptional 65.6% |
Demographics Similar to Kiowa by College, 1 year or more
In terms of college, 1 year or more, the demographic groups most similar to Kiowa are Immigrants from El Salvador (51.0%, a difference of 0.060%), Hopi (50.9%, a difference of 0.12%), Immigrants from Honduras (51.0%, a difference of 0.15%), Hispanic or Latino (51.1%, a difference of 0.28%), and Navajo (50.8%, a difference of 0.31%).
| Demographics | Rating | Rank | College, 1 year or more |
| Immigrants | Caribbean | 0.0 /100 | #313 | Tragic 51.4% |
| Fijians | 0.0 /100 | #314 | Tragic 51.3% |
| Guatemalans | 0.0 /100 | #315 | Tragic 51.2% |
| Cajuns | 0.0 /100 | #316 | Tragic 51.2% |
| Hispanics or Latinos | 0.0 /100 | #317 | Tragic 51.1% |
| Immigrants | Honduras | 0.0 /100 | #318 | Tragic 51.0% |
| Immigrants | El Salvador | 0.0 /100 | #319 | Tragic 51.0% |
| Kiowa | 0.0 /100 | #320 | Tragic 51.0% |
| Hopi | 0.0 /100 | #321 | Tragic 50.9% |
| Navajo | 0.0 /100 | #322 | Tragic 50.8% |
| Immigrants | Guatemala | 0.0 /100 | #323 | Tragic 50.7% |
| Immigrants | Cuba | 0.0 /100 | #324 | Tragic 50.7% |
| Immigrants | Latin America | 0.0 /100 | #325 | Tragic 50.7% |
| Dominicans | 0.0 /100 | #326 | Tragic 50.6% |
| Menominee | 0.0 /100 | #327 | Tragic 50.6% |