Soviet Union vs Canadian College, 1 year or more
COMPARE
Soviet Union
Canadian
College, 1 year or more
College, 1 year or more Comparison
Soviet Union
Canadians
66.4%
COLLEGE, 1 YEAR OR MORE
100.0/ 100
METRIC RATING
22nd/ 347
METRIC RANK
60.6%
COLLEGE, 1 YEAR OR MORE
82.7/ 100
METRIC RATING
143rd/ 347
METRIC RANK
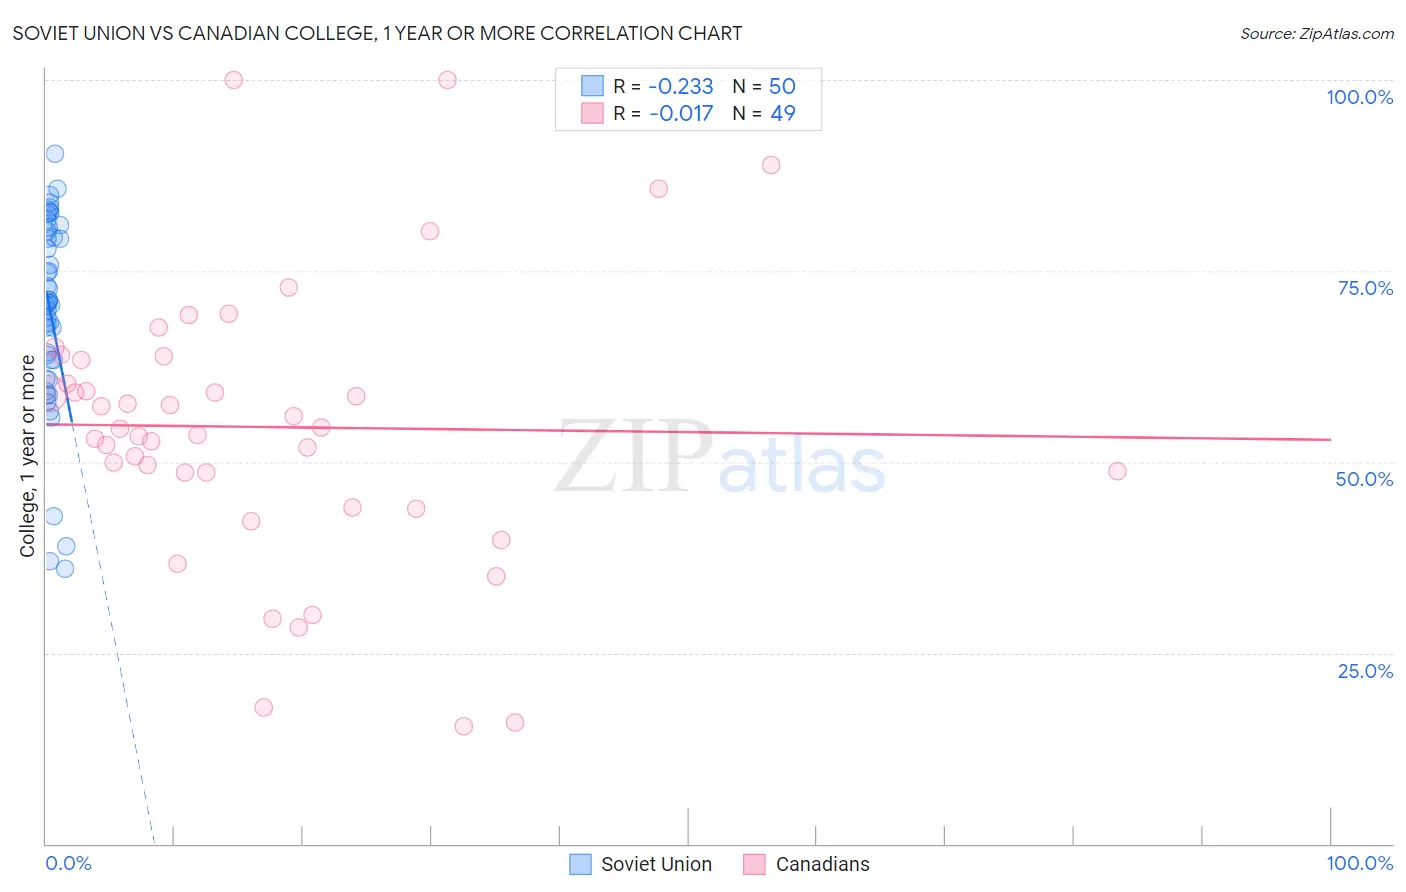
Soviet Union vs Canadian College, 1 year or more Correlation Chart
The statistical analysis conducted on geographies consisting of 43,514,626 people shows a weak negative correlation between the proportion of Soviet Union and percentage of population with at least college, 1 year or more education in the United States with a correlation coefficient (R) of -0.233 and weighted average of 66.4%. Similarly, the statistical analysis conducted on geographies consisting of 437,551,933 people shows no correlation between the proportion of Canadians and percentage of population with at least college, 1 year or more education in the United States with a correlation coefficient (R) of -0.017 and weighted average of 60.6%, a difference of 9.5%.
College, 1 year or more Correlation Summary
| Measurement | Soviet Union | Canadian |
| Minimum | 36.1% | 15.4% |
| Maximum | 90.4% | 100.0% |
| Range | 54.3% | 84.6% |
| Mean | 69.7% | 54.6% |
| Median | 70.9% | 54.3% |
| Interquartile 25% (IQ1) | 63.3% | 46.3% |
| Interquartile 75% (IQ3) | 80.2% | 63.6% |
| Interquartile Range (IQR) | 16.9% | 17.4% |
| Standard Deviation (Sample) | 12.8% | 18.4% |
| Standard Deviation (Population) | 12.6% | 18.2% |
Similar Demographics by College, 1 year or more
Demographics Similar to Soviet Union by College, 1 year or more
In terms of college, 1 year or more, the demographic groups most similar to Soviet Union are Immigrants from Hong Kong (66.4%, a difference of 0.060%), Immigrants from China (66.4%, a difference of 0.060%), Immigrants from Korea (66.5%, a difference of 0.13%), Immigrants from Belgium (66.3%, a difference of 0.14%), and Immigrants from Switzerland (66.5%, a difference of 0.17%).
| Demographics | Rating | Rank | College, 1 year or more |
| Cambodians | 100.0 /100 | #15 | Exceptional 66.7% |
| Immigrants | Japan | 100.0 /100 | #16 | Exceptional 66.7% |
| Immigrants | Eastern Asia | 100.0 /100 | #17 | Exceptional 66.6% |
| Eastern Europeans | 100.0 /100 | #18 | Exceptional 66.6% |
| Immigrants | Switzerland | 100.0 /100 | #19 | Exceptional 66.5% |
| Immigrants | Korea | 100.0 /100 | #20 | Exceptional 66.5% |
| Immigrants | Hong Kong | 100.0 /100 | #21 | Exceptional 66.4% |
| Soviet Union | 100.0 /100 | #22 | Exceptional 66.4% |
| Immigrants | China | 100.0 /100 | #23 | Exceptional 66.4% |
| Immigrants | Belgium | 100.0 /100 | #24 | Exceptional 66.3% |
| Indians (Asian) | 100.0 /100 | #25 | Exceptional 66.1% |
| Latvians | 100.0 /100 | #26 | Exceptional 66.1% |
| Immigrants | Ireland | 100.0 /100 | #27 | Exceptional 65.9% |
| Immigrants | France | 100.0 /100 | #28 | Exceptional 65.8% |
| Immigrants | Northern Europe | 100.0 /100 | #29 | Exceptional 65.6% |
Demographics Similar to Canadians by College, 1 year or more
In terms of college, 1 year or more, the demographic groups most similar to Canadians are Polish (60.7%, a difference of 0.010%), Immigrants from Afghanistan (60.7%, a difference of 0.040%), Iraqi (60.7%, a difference of 0.050%), Czech (60.6%, a difference of 0.080%), and Slavic (60.6%, a difference of 0.14%).
| Demographics | Rating | Rank | College, 1 year or more |
| Basques | 87.2 /100 | #136 | Excellent 60.9% |
| Slovenes | 86.5 /100 | #137 | Excellent 60.9% |
| Taiwanese | 84.3 /100 | #138 | Excellent 60.7% |
| Immigrants | Eritrea | 84.3 /100 | #139 | Excellent 60.7% |
| Iraqis | 83.3 /100 | #140 | Excellent 60.7% |
| Immigrants | Afghanistan | 83.1 /100 | #141 | Excellent 60.7% |
| Poles | 82.8 /100 | #142 | Excellent 60.7% |
| Canadians | 82.7 /100 | #143 | Excellent 60.6% |
| Czechs | 81.9 /100 | #144 | Excellent 60.6% |
| Slavs | 81.1 /100 | #145 | Excellent 60.6% |
| Scottish | 80.2 /100 | #146 | Excellent 60.5% |
| Immigrants | Kenya | 79.1 /100 | #147 | Good 60.5% |
| Kenyans | 79.0 /100 | #148 | Good 60.5% |
| Brazilians | 79.0 /100 | #149 | Good 60.5% |
| Immigrants | Sudan | 77.8 /100 | #150 | Good 60.4% |