Soviet Union vs Bermudan College, 1 year or more
COMPARE
Soviet Union
Bermudan
College, 1 year or more
College, 1 year or more Comparison
Soviet Union
Bermudans
66.4%
COLLEGE, 1 YEAR OR MORE
100.0/ 100
METRIC RATING
22nd/ 347
METRIC RANK
59.3%
COLLEGE, 1 YEAR OR MORE
46.6/ 100
METRIC RATING
179th/ 347
METRIC RANK
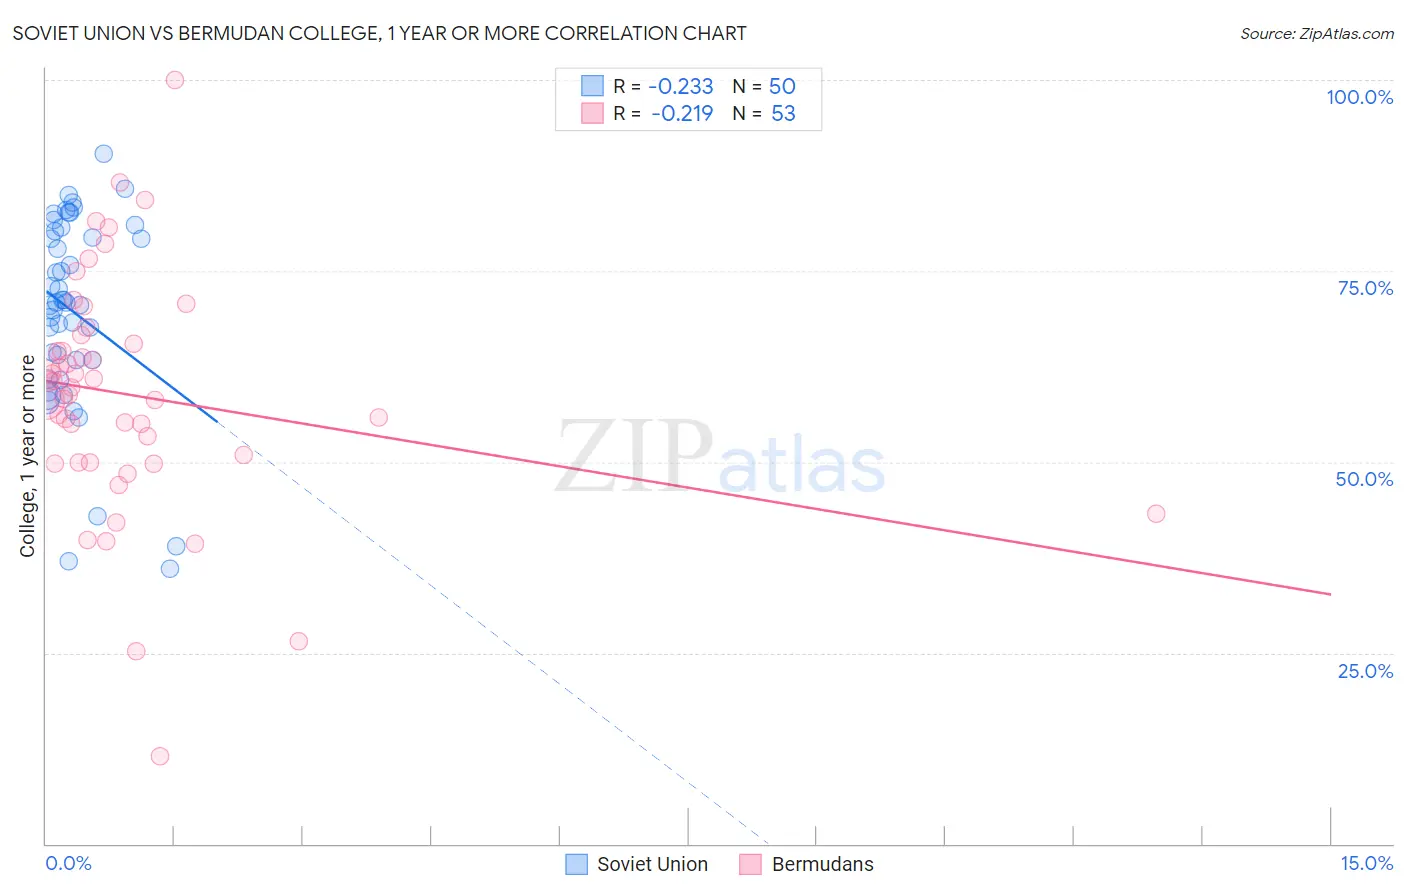
Soviet Union vs Bermudan College, 1 year or more Correlation Chart
The statistical analysis conducted on geographies consisting of 43,514,626 people shows a weak negative correlation between the proportion of Soviet Union and percentage of population with at least college, 1 year or more education in the United States with a correlation coefficient (R) of -0.233 and weighted average of 66.4%. Similarly, the statistical analysis conducted on geographies consisting of 55,732,793 people shows a weak negative correlation between the proportion of Bermudans and percentage of population with at least college, 1 year or more education in the United States with a correlation coefficient (R) of -0.219 and weighted average of 59.3%, a difference of 12.0%.
College, 1 year or more Correlation Summary
| Measurement | Soviet Union | Bermudan |
| Minimum | 36.1% | 11.4% |
| Maximum | 90.4% | 100.0% |
| Range | 54.3% | 88.6% |
| Mean | 69.7% | 58.8% |
| Median | 70.9% | 59.8% |
| Interquartile 25% (IQ1) | 63.3% | 49.9% |
| Interquartile 75% (IQ3) | 80.2% | 66.0% |
| Interquartile Range (IQR) | 16.9% | 16.1% |
| Standard Deviation (Sample) | 12.8% | 15.6% |
| Standard Deviation (Population) | 12.6% | 15.5% |
Similar Demographics by College, 1 year or more
Demographics Similar to Soviet Union by College, 1 year or more
In terms of college, 1 year or more, the demographic groups most similar to Soviet Union are Immigrants from Hong Kong (66.4%, a difference of 0.060%), Immigrants from China (66.4%, a difference of 0.060%), Immigrants from Korea (66.5%, a difference of 0.13%), Immigrants from Belgium (66.3%, a difference of 0.14%), and Immigrants from Switzerland (66.5%, a difference of 0.17%).
| Demographics | Rating | Rank | College, 1 year or more |
| Cambodians | 100.0 /100 | #15 | Exceptional 66.7% |
| Immigrants | Japan | 100.0 /100 | #16 | Exceptional 66.7% |
| Immigrants | Eastern Asia | 100.0 /100 | #17 | Exceptional 66.6% |
| Eastern Europeans | 100.0 /100 | #18 | Exceptional 66.6% |
| Immigrants | Switzerland | 100.0 /100 | #19 | Exceptional 66.5% |
| Immigrants | Korea | 100.0 /100 | #20 | Exceptional 66.5% |
| Immigrants | Hong Kong | 100.0 /100 | #21 | Exceptional 66.4% |
| Soviet Union | 100.0 /100 | #22 | Exceptional 66.4% |
| Immigrants | China | 100.0 /100 | #23 | Exceptional 66.4% |
| Immigrants | Belgium | 100.0 /100 | #24 | Exceptional 66.3% |
| Indians (Asian) | 100.0 /100 | #25 | Exceptional 66.1% |
| Latvians | 100.0 /100 | #26 | Exceptional 66.1% |
| Immigrants | Ireland | 100.0 /100 | #27 | Exceptional 65.9% |
| Immigrants | France | 100.0 /100 | #28 | Exceptional 65.8% |
| Immigrants | Northern Europe | 100.0 /100 | #29 | Exceptional 65.6% |
Demographics Similar to Bermudans by College, 1 year or more
In terms of college, 1 year or more, the demographic groups most similar to Bermudans are Czechoslovakian (59.4%, a difference of 0.090%), Tlingit-Haida (59.4%, a difference of 0.10%), Immigrants from Poland (59.4%, a difference of 0.12%), Sri Lankan (59.4%, a difference of 0.13%), and Yugoslavian (59.2%, a difference of 0.14%).
| Demographics | Rating | Rank | College, 1 year or more |
| Immigrants | Sierra Leone | 52.2 /100 | #172 | Average 59.5% |
| Immigrants | Oceania | 51.2 /100 | #173 | Average 59.4% |
| Celtics | 50.0 /100 | #174 | Average 59.4% |
| Sri Lankans | 49.0 /100 | #175 | Average 59.4% |
| Immigrants | Poland | 48.9 /100 | #176 | Average 59.4% |
| Tlingit-Haida | 48.4 /100 | #177 | Average 59.4% |
| Czechoslovakians | 48.3 /100 | #178 | Average 59.4% |
| Bermudans | 46.6 /100 | #179 | Average 59.3% |
| Yugoslavians | 44.1 /100 | #180 | Average 59.2% |
| Swiss | 43.4 /100 | #181 | Average 59.2% |
| Immigrants | Bosnia and Herzegovina | 42.8 /100 | #182 | Average 59.2% |
| German Russians | 39.3 /100 | #183 | Fair 59.1% |
| Spaniards | 38.3 /100 | #184 | Fair 59.0% |
| South Americans | 35.9 /100 | #185 | Fair 59.0% |
| Scotch-Irish | 34.7 /100 | #186 | Fair 58.9% |