Soviet Union vs Immigrants from Pakistan College, 1 year or more
COMPARE
Soviet Union
Immigrants from Pakistan
College, 1 year or more
College, 1 year or more Comparison
Soviet Union
Immigrants from Pakistan
66.4%
COLLEGE, 1 YEAR OR MORE
100.0/ 100
METRIC RATING
22nd/ 347
METRIC RANK
62.8%
COLLEGE, 1 YEAR OR MORE
98.6/ 100
METRIC RATING
85th/ 347
METRIC RANK
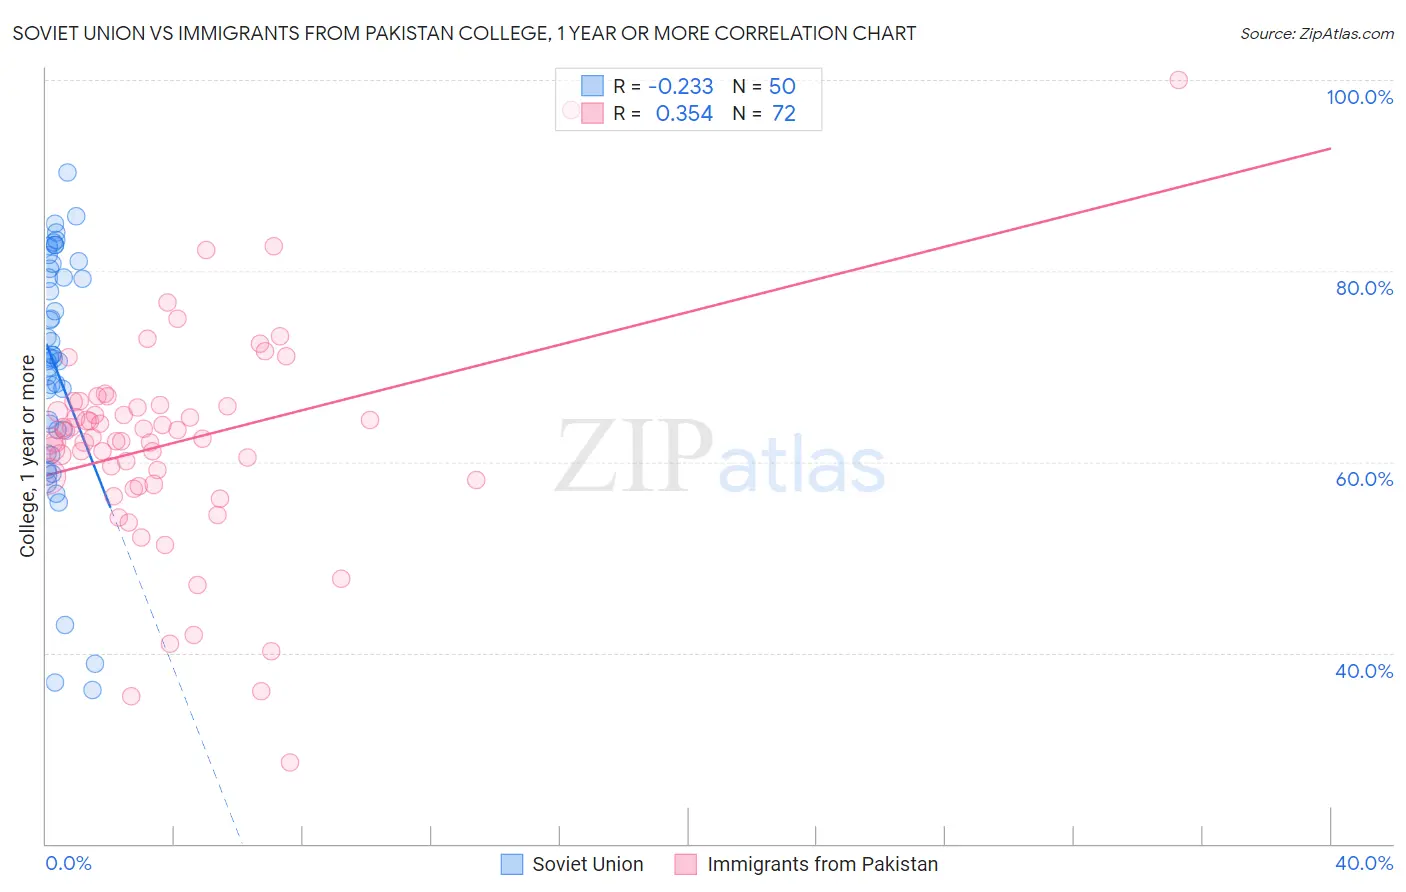
Soviet Union vs Immigrants from Pakistan College, 1 year or more Correlation Chart
The statistical analysis conducted on geographies consisting of 43,514,626 people shows a weak negative correlation between the proportion of Soviet Union and percentage of population with at least college, 1 year or more education in the United States with a correlation coefficient (R) of -0.233 and weighted average of 66.4%. Similarly, the statistical analysis conducted on geographies consisting of 283,910,237 people shows a mild positive correlation between the proportion of Immigrants from Pakistan and percentage of population with at least college, 1 year or more education in the United States with a correlation coefficient (R) of 0.354 and weighted average of 62.8%, a difference of 5.8%.
College, 1 year or more Correlation Summary
| Measurement | Soviet Union | Immigrants from Pakistan |
| Minimum | 36.1% | 28.6% |
| Maximum | 90.4% | 100.0% |
| Range | 54.3% | 71.4% |
| Mean | 69.7% | 62.0% |
| Median | 70.9% | 62.5% |
| Interquartile 25% (IQ1) | 63.3% | 57.9% |
| Interquartile 75% (IQ3) | 80.2% | 65.9% |
| Interquartile Range (IQR) | 16.9% | 8.1% |
| Standard Deviation (Sample) | 12.8% | 11.6% |
| Standard Deviation (Population) | 12.6% | 11.5% |
Similar Demographics by College, 1 year or more
Demographics Similar to Soviet Union by College, 1 year or more
In terms of college, 1 year or more, the demographic groups most similar to Soviet Union are Immigrants from Hong Kong (66.4%, a difference of 0.060%), Immigrants from China (66.4%, a difference of 0.060%), Immigrants from Korea (66.5%, a difference of 0.13%), Immigrants from Belgium (66.3%, a difference of 0.14%), and Immigrants from Switzerland (66.5%, a difference of 0.17%).
| Demographics | Rating | Rank | College, 1 year or more |
| Cambodians | 100.0 /100 | #15 | Exceptional 66.7% |
| Immigrants | Japan | 100.0 /100 | #16 | Exceptional 66.7% |
| Immigrants | Eastern Asia | 100.0 /100 | #17 | Exceptional 66.6% |
| Eastern Europeans | 100.0 /100 | #18 | Exceptional 66.6% |
| Immigrants | Switzerland | 100.0 /100 | #19 | Exceptional 66.5% |
| Immigrants | Korea | 100.0 /100 | #20 | Exceptional 66.5% |
| Immigrants | Hong Kong | 100.0 /100 | #21 | Exceptional 66.4% |
| Soviet Union | 100.0 /100 | #22 | Exceptional 66.4% |
| Immigrants | China | 100.0 /100 | #23 | Exceptional 66.4% |
| Immigrants | Belgium | 100.0 /100 | #24 | Exceptional 66.3% |
| Indians (Asian) | 100.0 /100 | #25 | Exceptional 66.1% |
| Latvians | 100.0 /100 | #26 | Exceptional 66.1% |
| Immigrants | Ireland | 100.0 /100 | #27 | Exceptional 65.9% |
| Immigrants | France | 100.0 /100 | #28 | Exceptional 65.8% |
| Immigrants | Northern Europe | 100.0 /100 | #29 | Exceptional 65.6% |
Demographics Similar to Immigrants from Pakistan by College, 1 year or more
In terms of college, 1 year or more, the demographic groups most similar to Immigrants from Pakistan are Immigrants from England (62.8%, a difference of 0.010%), Immigrants from Western Europe (62.7%, a difference of 0.020%), Immigrants from Argentina (62.8%, a difference of 0.040%), Immigrants from Hungary (62.7%, a difference of 0.040%), and Immigrants from Bolivia (62.8%, a difference of 0.080%).
| Demographics | Rating | Rank | College, 1 year or more |
| Immigrants | Lebanon | 98.8 /100 | #78 | Exceptional 62.9% |
| Northern Europeans | 98.8 /100 | #79 | Exceptional 62.9% |
| Lithuanians | 98.8 /100 | #80 | Exceptional 62.9% |
| Laotians | 98.7 /100 | #81 | Exceptional 62.8% |
| Immigrants | Bolivia | 98.7 /100 | #82 | Exceptional 62.8% |
| Immigrants | Argentina | 98.6 /100 | #83 | Exceptional 62.8% |
| Immigrants | England | 98.6 /100 | #84 | Exceptional 62.8% |
| Immigrants | Pakistan | 98.6 /100 | #85 | Exceptional 62.8% |
| Immigrants | Western Europe | 98.6 /100 | #86 | Exceptional 62.7% |
| Immigrants | Hungary | 98.6 /100 | #87 | Exceptional 62.7% |
| Greeks | 98.3 /100 | #88 | Exceptional 62.6% |
| Immigrants | Ethiopia | 98.2 /100 | #89 | Exceptional 62.6% |
| Immigrants | Western Asia | 97.9 /100 | #90 | Exceptional 62.5% |
| Immigrants | Eastern Europe | 97.8 /100 | #91 | Exceptional 62.4% |
| Immigrants | Egypt | 97.8 /100 | #92 | Exceptional 62.4% |