Soviet Union vs Immigrants from Africa Nursery School
COMPARE
Soviet Union
Immigrants from Africa
Nursery School
Nursery School Comparison
Soviet Union
Immigrants from Africa
98.0%
NURSERY SCHOOL
71.6/ 100
METRIC RATING
151st/ 347
METRIC RANK
97.6%
NURSERY SCHOOL
0.8/ 100
METRIC RATING
252nd/ 347
METRIC RANK
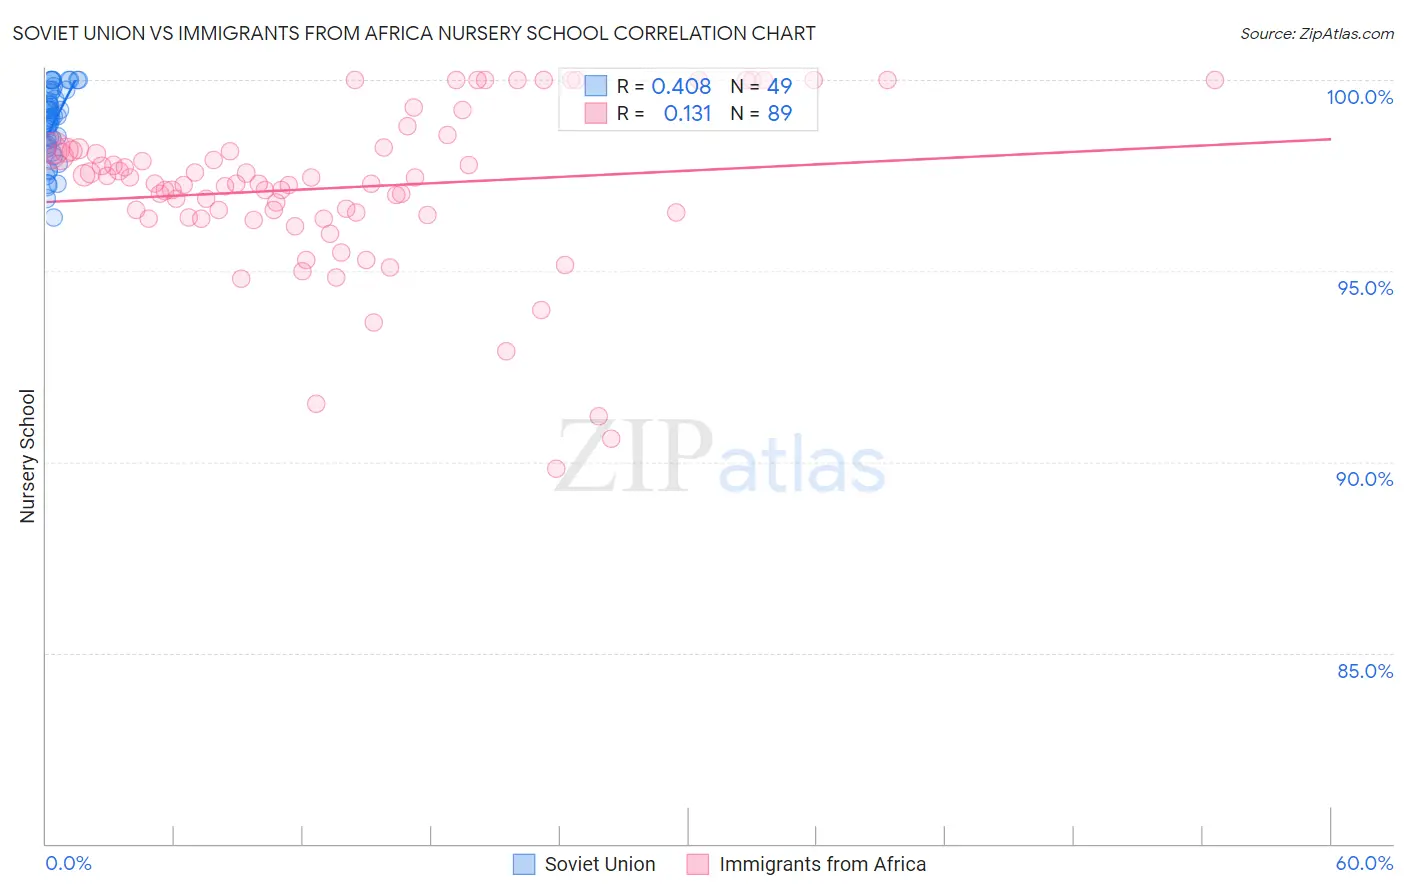
Soviet Union vs Immigrants from Africa Nursery School Correlation Chart
The statistical analysis conducted on geographies consisting of 43,454,395 people shows a moderate positive correlation between the proportion of Soviet Union and percentage of population with at least nursery school education in the United States with a correlation coefficient (R) of 0.408 and weighted average of 98.0%. Similarly, the statistical analysis conducted on geographies consisting of 469,440,174 people shows a poor positive correlation between the proportion of Immigrants from Africa and percentage of population with at least nursery school education in the United States with a correlation coefficient (R) of 0.131 and weighted average of 97.6%, a difference of 0.44%.
Nursery School Correlation Summary
| Measurement | Soviet Union | Immigrants from Africa |
| Minimum | 96.4% | 89.8% |
| Maximum | 100.0% | 100.0% |
| Range | 3.6% | 10.2% |
| Mean | 98.8% | 97.2% |
| Median | 99.0% | 97.3% |
| Interquartile 25% (IQ1) | 98.2% | 96.4% |
| Interquartile 75% (IQ3) | 99.7% | 98.2% |
| Interquartile Range (IQR) | 1.5% | 1.7% |
| Standard Deviation (Sample) | 0.95% | 2.1% |
| Standard Deviation (Population) | 0.94% | 2.1% |
Similar Demographics by Nursery School
Demographics Similar to Soviet Union by Nursery School
In terms of nursery school, the demographic groups most similar to Soviet Union are Jordanian (98.1%, a difference of 0.0%), Immigrants from Greece (98.1%, a difference of 0.010%), Apache (98.1%, a difference of 0.010%), Dutch West Indian (98.0%, a difference of 0.010%), and Immigrants from Moldova (98.0%, a difference of 0.010%).
| Demographics | Rating | Rank | Nursery School |
| Alsatians | 80.3 /100 | #144 | Excellent 98.1% |
| Immigrants | Israel | 78.5 /100 | #145 | Good 98.1% |
| Filipinos | 78.5 /100 | #146 | Good 98.1% |
| Hmong | 75.7 /100 | #147 | Good 98.1% |
| Immigrants | Greece | 75.4 /100 | #148 | Good 98.1% |
| Apache | 73.2 /100 | #149 | Good 98.1% |
| Jordanians | 72.9 /100 | #150 | Good 98.1% |
| Soviet Union | 71.6 /100 | #151 | Good 98.0% |
| Dutch West Indians | 70.2 /100 | #152 | Good 98.0% |
| Immigrants | Moldova | 69.6 /100 | #153 | Good 98.0% |
| Immigrants | Iran | 68.7 /100 | #154 | Good 98.0% |
| Immigrants | South Central Asia | 66.7 /100 | #155 | Good 98.0% |
| Venezuelans | 66.6 /100 | #156 | Good 98.0% |
| Comanche | 66.0 /100 | #157 | Good 98.0% |
| Immigrants | North Macedonia | 65.7 /100 | #158 | Good 98.0% |
Demographics Similar to Immigrants from Africa by Nursery School
In terms of nursery school, the demographic groups most similar to Immigrants from Africa are Ethiopian (97.6%, a difference of 0.0%), Immigrants from Iraq (97.6%, a difference of 0.0%), Immigrants from Eastern Africa (97.6%, a difference of 0.010%), Immigrants from Senegal (97.6%, a difference of 0.010%), and Immigrants from Congo (97.6%, a difference of 0.010%).
| Demographics | Rating | Rank | Nursery School |
| Bolivians | 1.0 /100 | #245 | Tragic 97.6% |
| Peruvians | 1.0 /100 | #246 | Tragic 97.6% |
| Immigrants | Middle Africa | 0.9 /100 | #247 | Tragic 97.6% |
| Indians (Asian) | 0.9 /100 | #248 | Tragic 97.6% |
| Immigrants | Eastern Africa | 0.9 /100 | #249 | Tragic 97.6% |
| Immigrants | Senegal | 0.9 /100 | #250 | Tragic 97.6% |
| Ethiopians | 0.8 /100 | #251 | Tragic 97.6% |
| Immigrants | Africa | 0.8 /100 | #252 | Tragic 97.6% |
| Immigrants | Iraq | 0.7 /100 | #253 | Tragic 97.6% |
| Immigrants | Congo | 0.7 /100 | #254 | Tragic 97.6% |
| Immigrants | Asia | 0.7 /100 | #255 | Tragic 97.6% |
| Yaqui | 0.6 /100 | #256 | Tragic 97.6% |
| Immigrants | Colombia | 0.6 /100 | #257 | Tragic 97.6% |
| Jamaicans | 0.6 /100 | #258 | Tragic 97.6% |
| Armenians | 0.4 /100 | #259 | Tragic 97.6% |