Malaysian vs Immigrants from Morocco Nursery School
COMPARE
Malaysian
Immigrants from Morocco
Nursery School
Nursery School Comparison
Malaysians
Immigrants from Morocco
97.3%
NURSERY SCHOOL
0.0/ 100
METRIC RATING
293rd/ 347
METRIC RANK
97.8%
NURSERY SCHOOL
5.1/ 100
METRIC RATING
219th/ 347
METRIC RANK
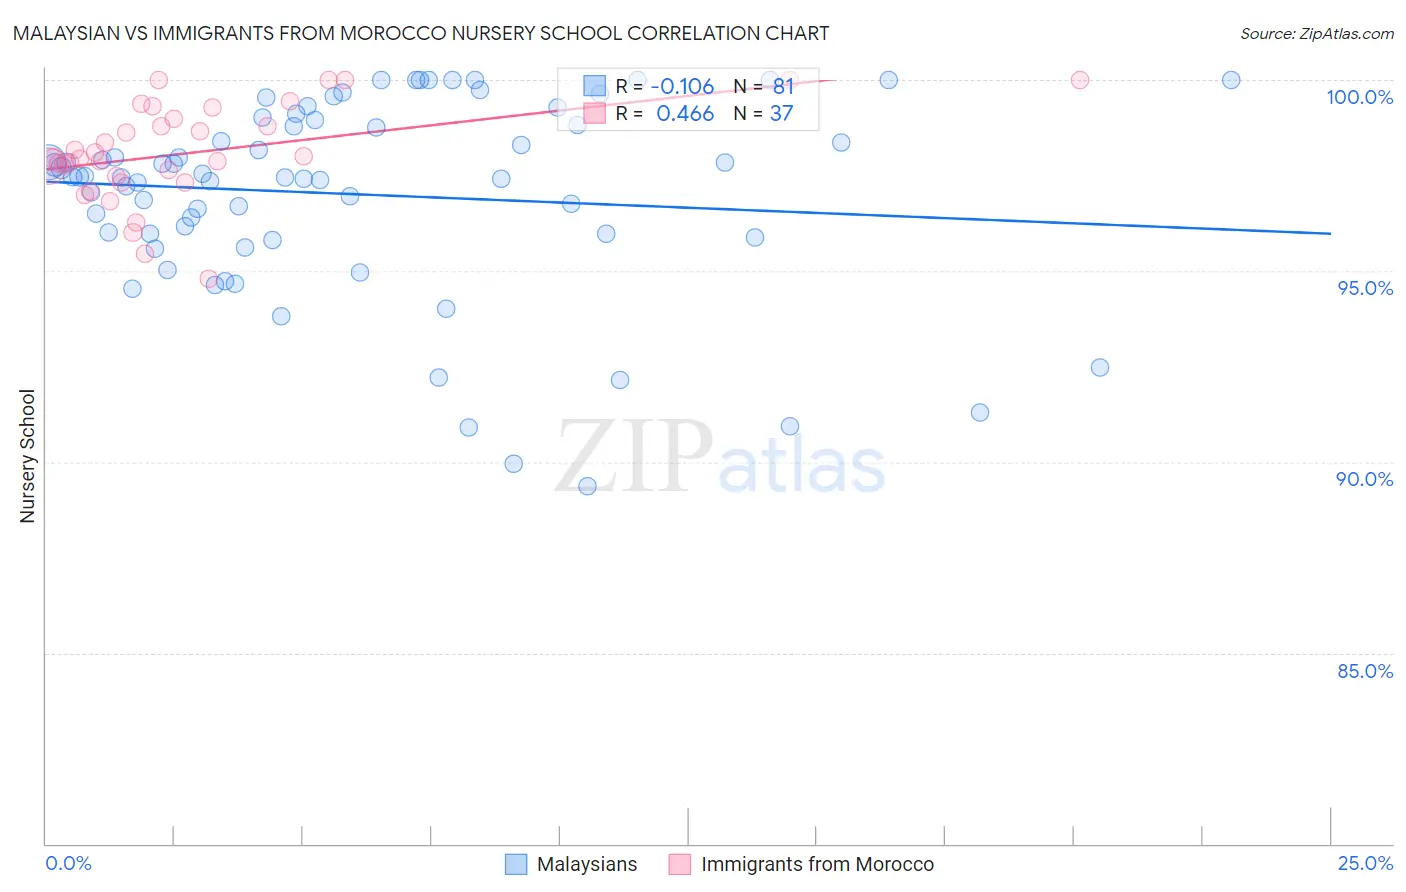
Malaysian vs Immigrants from Morocco Nursery School Correlation Chart
The statistical analysis conducted on geographies consisting of 226,107,000 people shows a poor negative correlation between the proportion of Malaysians and percentage of population with at least nursery school education in the United States with a correlation coefficient (R) of -0.106 and weighted average of 97.3%. Similarly, the statistical analysis conducted on geographies consisting of 178,912,438 people shows a moderate positive correlation between the proportion of Immigrants from Morocco and percentage of population with at least nursery school education in the United States with a correlation coefficient (R) of 0.466 and weighted average of 97.8%, a difference of 0.52%.
Nursery School Correlation Summary
| Measurement | Malaysian | Immigrants from Morocco |
| Minimum | 89.4% | 94.8% |
| Maximum | 100.0% | 100.0% |
| Range | 10.6% | 5.2% |
| Mean | 97.0% | 98.1% |
| Median | 97.5% | 98.0% |
| Interquartile 25% (IQ1) | 95.9% | 97.4% |
| Interquartile 75% (IQ3) | 98.9% | 99.1% |
| Interquartile Range (IQR) | 3.0% | 1.7% |
| Standard Deviation (Sample) | 2.5% | 1.3% |
| Standard Deviation (Population) | 2.5% | 1.3% |
Similar Demographics by Nursery School
Demographics Similar to Malaysians by Nursery School
In terms of nursery school, the demographic groups most similar to Malaysians are Houma (97.3%, a difference of 0.010%), Immigrants from Grenada (97.3%, a difference of 0.010%), Immigrants (97.2%, a difference of 0.020%), British West Indian (97.3%, a difference of 0.030%), and Immigrants from Eritrea (97.2%, a difference of 0.030%).
| Demographics | Rating | Rank | Nursery School |
| Immigrants | Portugal | 0.0 /100 | #286 | Tragic 97.4% |
| Immigrants | Hong Kong | 0.0 /100 | #287 | Tragic 97.4% |
| Immigrants | Thailand | 0.0 /100 | #288 | Tragic 97.3% |
| Immigrants | St. Vincent and the Grenadines | 0.0 /100 | #289 | Tragic 97.3% |
| Immigrants | Afghanistan | 0.0 /100 | #290 | Tragic 97.3% |
| British West Indians | 0.0 /100 | #291 | Tragic 97.3% |
| Houma | 0.0 /100 | #292 | Tragic 97.3% |
| Malaysians | 0.0 /100 | #293 | Tragic 97.3% |
| Immigrants | Grenada | 0.0 /100 | #294 | Tragic 97.3% |
| Immigrants | Immigrants | 0.0 /100 | #295 | Tragic 97.2% |
| Immigrants | Eritrea | 0.0 /100 | #296 | Tragic 97.2% |
| Immigrants | Cuba | 0.0 /100 | #297 | Tragic 97.2% |
| Central American Indians | 0.0 /100 | #298 | Tragic 97.2% |
| Immigrants | Dominica | 0.0 /100 | #299 | Tragic 97.2% |
| Haitians | 0.0 /100 | #300 | Tragic 97.2% |
Demographics Similar to Immigrants from Morocco by Nursery School
In terms of nursery school, the demographic groups most similar to Immigrants from Morocco are Immigrants from Panama (97.8%, a difference of 0.0%), Immigrants from Zaire (97.8%, a difference of 0.010%), Tongan (97.8%, a difference of 0.010%), Samoan (97.8%, a difference of 0.020%), and Immigrants from Syria (97.7%, a difference of 0.020%).
| Demographics | Rating | Rank | Nursery School |
| Immigrants | Bahamas | 8.6 /100 | #212 | Tragic 97.8% |
| Moroccans | 8.3 /100 | #213 | Tragic 97.8% |
| South American Indians | 8.0 /100 | #214 | Tragic 97.8% |
| Bahamians | 7.4 /100 | #215 | Tragic 97.8% |
| Uruguayans | 7.1 /100 | #216 | Tragic 97.8% |
| Samoans | 6.3 /100 | #217 | Tragic 97.8% |
| Immigrants | Panama | 5.3 /100 | #218 | Tragic 97.8% |
| Immigrants | Morocco | 5.1 /100 | #219 | Tragic 97.8% |
| Immigrants | Zaire | 4.4 /100 | #220 | Tragic 97.8% |
| Tongans | 4.3 /100 | #221 | Tragic 97.8% |
| Immigrants | Syria | 4.0 /100 | #222 | Tragic 97.7% |
| Immigrants | Sudan | 3.9 /100 | #223 | Tragic 97.7% |
| Immigrants | Nepal | 3.6 /100 | #224 | Tragic 97.7% |
| Immigrants | Costa Rica | 3.5 /100 | #225 | Tragic 97.7% |
| Iraqis | 3.5 /100 | #226 | Tragic 97.7% |