Immigrants from El Salvador vs Immigrants from Morocco Nursery School
COMPARE
Immigrants from El Salvador
Immigrants from Morocco
Nursery School
Nursery School Comparison
Immigrants from El Salvador
Immigrants from Morocco
96.2%
NURSERY SCHOOL
0.0/ 100
METRIC RATING
344th/ 347
METRIC RANK
97.8%
NURSERY SCHOOL
5.1/ 100
METRIC RATING
219th/ 347
METRIC RANK
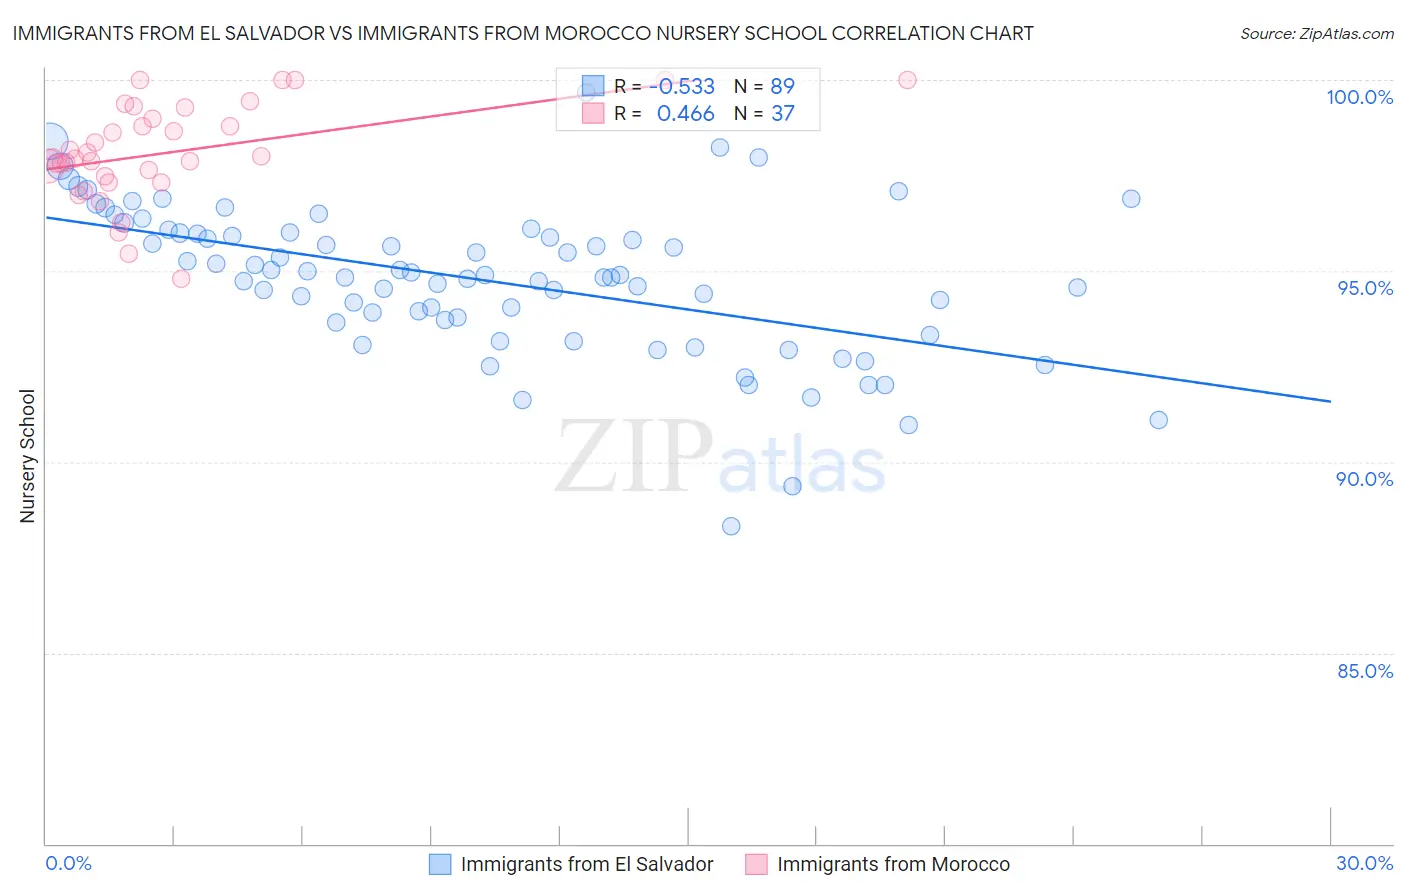
Immigrants from El Salvador vs Immigrants from Morocco Nursery School Correlation Chart
The statistical analysis conducted on geographies consisting of 357,698,489 people shows a substantial negative correlation between the proportion of Immigrants from El Salvador and percentage of population with at least nursery school education in the United States with a correlation coefficient (R) of -0.533 and weighted average of 96.2%. Similarly, the statistical analysis conducted on geographies consisting of 178,912,438 people shows a moderate positive correlation between the proportion of Immigrants from Morocco and percentage of population with at least nursery school education in the United States with a correlation coefficient (R) of 0.466 and weighted average of 97.8%, a difference of 1.6%.
Nursery School Correlation Summary
| Measurement | Immigrants from El Salvador | Immigrants from Morocco |
| Minimum | 88.3% | 94.8% |
| Maximum | 99.7% | 100.0% |
| Range | 11.4% | 5.2% |
| Mean | 94.8% | 98.1% |
| Median | 94.9% | 98.0% |
| Interquartile 25% (IQ1) | 93.7% | 97.4% |
| Interquartile 75% (IQ3) | 96.0% | 99.1% |
| Interquartile Range (IQR) | 2.3% | 1.7% |
| Standard Deviation (Sample) | 2.0% | 1.3% |
| Standard Deviation (Population) | 2.0% | 1.3% |
Similar Demographics by Nursery School
Demographics Similar to Immigrants from El Salvador by Nursery School
In terms of nursery school, the demographic groups most similar to Immigrants from El Salvador are Nepalese (96.2%, a difference of 0.010%), Salvadoran (96.4%, a difference of 0.15%), Immigrants from Mexico (96.4%, a difference of 0.18%), Immigrants from Cabo Verde (96.4%, a difference of 0.19%), and Immigrants from Central America (96.4%, a difference of 0.21%).
| Demographics | Rating | Rank | Nursery School |
| Central Americans | 0.0 /100 | #333 | Tragic 96.6% |
| Immigrants | Dominican Republic | 0.0 /100 | #334 | Tragic 96.6% |
| Bangladeshis | 0.0 /100 | #335 | Tragic 96.6% |
| Guatemalans | 0.0 /100 | #336 | Tragic 96.6% |
| Immigrants | Cambodia | 0.0 /100 | #337 | Tragic 96.5% |
| Immigrants | Fiji | 0.0 /100 | #338 | Tragic 96.5% |
| Immigrants | Guatemala | 0.0 /100 | #339 | Tragic 96.4% |
| Immigrants | Central America | 0.0 /100 | #340 | Tragic 96.4% |
| Immigrants | Cabo Verde | 0.0 /100 | #341 | Tragic 96.4% |
| Immigrants | Mexico | 0.0 /100 | #342 | Tragic 96.4% |
| Salvadorans | 0.0 /100 | #343 | Tragic 96.4% |
| Immigrants | El Salvador | 0.0 /100 | #344 | Tragic 96.2% |
| Nepalese | 0.0 /100 | #345 | Tragic 96.2% |
| Immigrants | Yemen | 0.0 /100 | #346 | Tragic 95.9% |
| Spanish American Indians | 0.0 /100 | #347 | Tragic 95.8% |
Demographics Similar to Immigrants from Morocco by Nursery School
In terms of nursery school, the demographic groups most similar to Immigrants from Morocco are Immigrants from Panama (97.8%, a difference of 0.0%), Immigrants from Zaire (97.8%, a difference of 0.010%), Tongan (97.8%, a difference of 0.010%), Samoan (97.8%, a difference of 0.020%), and Immigrants from Syria (97.7%, a difference of 0.020%).
| Demographics | Rating | Rank | Nursery School |
| Immigrants | Bahamas | 8.6 /100 | #212 | Tragic 97.8% |
| Moroccans | 8.3 /100 | #213 | Tragic 97.8% |
| South American Indians | 8.0 /100 | #214 | Tragic 97.8% |
| Bahamians | 7.4 /100 | #215 | Tragic 97.8% |
| Uruguayans | 7.1 /100 | #216 | Tragic 97.8% |
| Samoans | 6.3 /100 | #217 | Tragic 97.8% |
| Immigrants | Panama | 5.3 /100 | #218 | Tragic 97.8% |
| Immigrants | Morocco | 5.1 /100 | #219 | Tragic 97.8% |
| Immigrants | Zaire | 4.4 /100 | #220 | Tragic 97.8% |
| Tongans | 4.3 /100 | #221 | Tragic 97.8% |
| Immigrants | Syria | 4.0 /100 | #222 | Tragic 97.7% |
| Immigrants | Sudan | 3.9 /100 | #223 | Tragic 97.7% |
| Immigrants | Nepal | 3.6 /100 | #224 | Tragic 97.7% |
| Immigrants | Costa Rica | 3.5 /100 | #225 | Tragic 97.7% |
| Iraqis | 3.5 /100 | #226 | Tragic 97.7% |