Soviet Union vs Immigrants from Bosnia and Herzegovina Nursery School
COMPARE
Soviet Union
Immigrants from Bosnia and Herzegovina
Nursery School
Nursery School Comparison
Soviet Union
Immigrants from Bosnia and Herzegovina
98.0%
NURSERY SCHOOL
71.6/ 100
METRIC RATING
151st/ 347
METRIC RANK
98.0%
NURSERY SCHOOL
45.6/ 100
METRIC RATING
180th/ 347
METRIC RANK
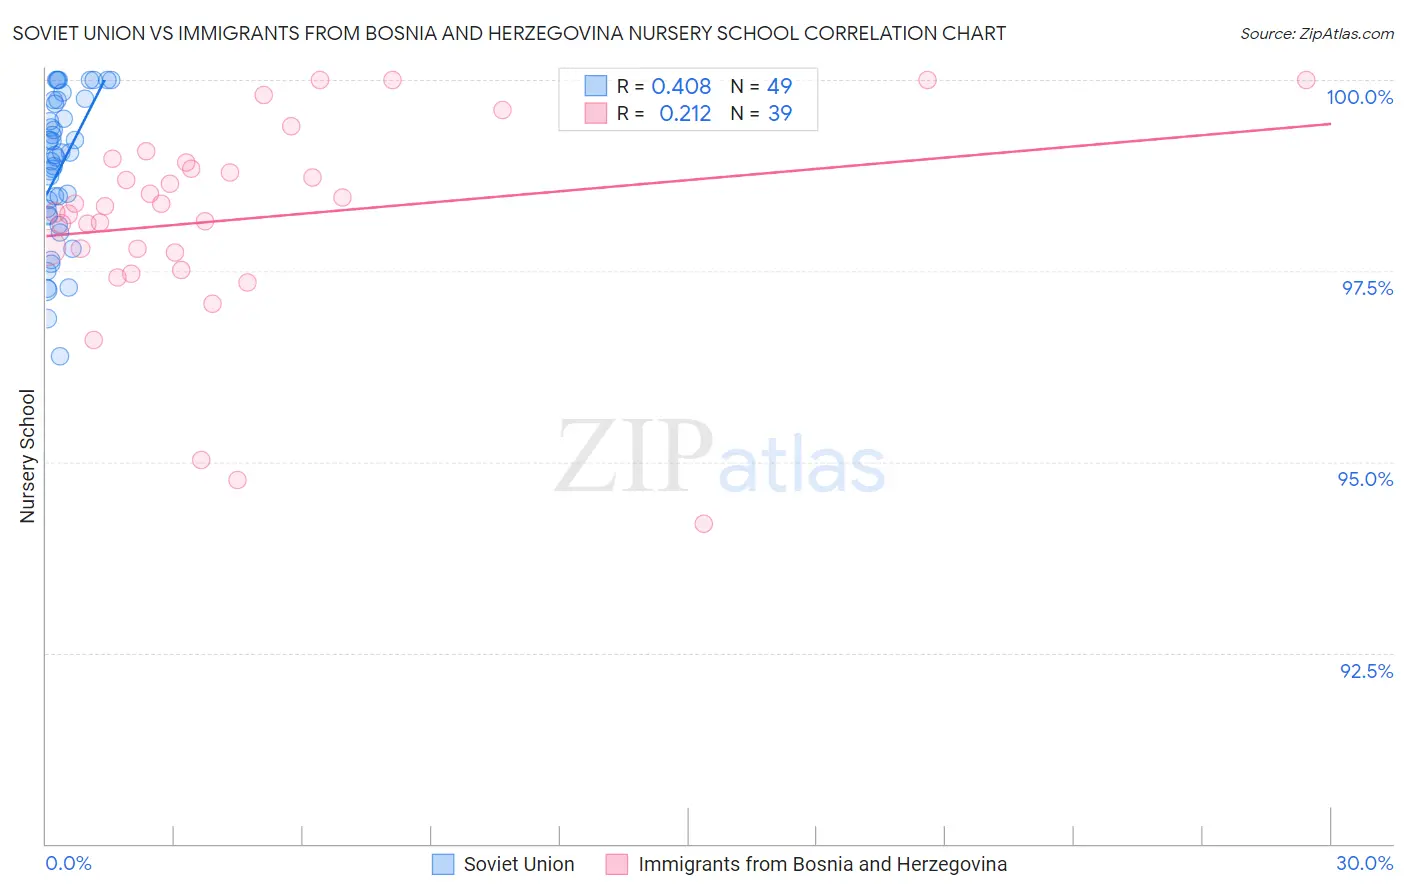
Soviet Union vs Immigrants from Bosnia and Herzegovina Nursery School Correlation Chart
The statistical analysis conducted on geographies consisting of 43,454,395 people shows a moderate positive correlation between the proportion of Soviet Union and percentage of population with at least nursery school education in the United States with a correlation coefficient (R) of 0.408 and weighted average of 98.0%. Similarly, the statistical analysis conducted on geographies consisting of 156,779,463 people shows a weak positive correlation between the proportion of Immigrants from Bosnia and Herzegovina and percentage of population with at least nursery school education in the United States with a correlation coefficient (R) of 0.212 and weighted average of 98.0%, a difference of 0.080%.
Nursery School Correlation Summary
| Measurement | Soviet Union | Immigrants from Bosnia and Herzegovina |
| Minimum | 96.4% | 94.2% |
| Maximum | 100.0% | 100.0% |
| Range | 3.6% | 5.8% |
| Mean | 98.8% | 98.2% |
| Median | 99.0% | 98.3% |
| Interquartile 25% (IQ1) | 98.2% | 97.7% |
| Interquartile 75% (IQ3) | 99.7% | 98.9% |
| Interquartile Range (IQR) | 1.5% | 1.2% |
| Standard Deviation (Sample) | 0.95% | 1.3% |
| Standard Deviation (Population) | 0.94% | 1.3% |
Similar Demographics by Nursery School
Demographics Similar to Soviet Union by Nursery School
In terms of nursery school, the demographic groups most similar to Soviet Union are Jordanian (98.1%, a difference of 0.0%), Immigrants from Greece (98.1%, a difference of 0.010%), Apache (98.1%, a difference of 0.010%), Dutch West Indian (98.0%, a difference of 0.010%), and Immigrants from Moldova (98.0%, a difference of 0.010%).
| Demographics | Rating | Rank | Nursery School |
| Alsatians | 80.3 /100 | #144 | Excellent 98.1% |
| Immigrants | Israel | 78.5 /100 | #145 | Good 98.1% |
| Filipinos | 78.5 /100 | #146 | Good 98.1% |
| Hmong | 75.7 /100 | #147 | Good 98.1% |
| Immigrants | Greece | 75.4 /100 | #148 | Good 98.1% |
| Apache | 73.2 /100 | #149 | Good 98.1% |
| Jordanians | 72.9 /100 | #150 | Good 98.1% |
| Soviet Union | 71.6 /100 | #151 | Good 98.0% |
| Dutch West Indians | 70.2 /100 | #152 | Good 98.0% |
| Immigrants | Moldova | 69.6 /100 | #153 | Good 98.0% |
| Immigrants | Iran | 68.7 /100 | #154 | Good 98.0% |
| Immigrants | South Central Asia | 66.7 /100 | #155 | Good 98.0% |
| Venezuelans | 66.6 /100 | #156 | Good 98.0% |
| Comanche | 66.0 /100 | #157 | Good 98.0% |
| Immigrants | North Macedonia | 65.7 /100 | #158 | Good 98.0% |
Demographics Similar to Immigrants from Bosnia and Herzegovina by Nursery School
In terms of nursery school, the demographic groups most similar to Immigrants from Bosnia and Herzegovina are Argentinean (98.0%, a difference of 0.0%), Kenyan (98.0%, a difference of 0.010%), Navajo (98.0%, a difference of 0.010%), Immigrants from Sri Lanka (98.0%, a difference of 0.010%), and Immigrants from Venezuela (98.0%, a difference of 0.010%).
| Demographics | Rating | Rank | Nursery School |
| Kenyans | 50.2 /100 | #173 | Average 98.0% |
| Navajo | 50.0 /100 | #174 | Average 98.0% |
| Immigrants | Sri Lanka | 49.9 /100 | #175 | Average 98.0% |
| Immigrants | Venezuela | 49.8 /100 | #176 | Average 98.0% |
| Albanians | 48.9 /100 | #177 | Average 98.0% |
| Natives/Alaskans | 48.6 /100 | #178 | Average 98.0% |
| Argentineans | 46.8 /100 | #179 | Average 98.0% |
| Immigrants | Bosnia and Herzegovina | 45.6 /100 | #180 | Average 98.0% |
| Egyptians | 42.8 /100 | #181 | Average 98.0% |
| Paiute | 42.0 /100 | #182 | Average 98.0% |
| Portuguese | 41.8 /100 | #183 | Average 98.0% |
| Immigrants | Poland | 41.3 /100 | #184 | Average 98.0% |
| Immigrants | Belarus | 41.0 /100 | #185 | Average 98.0% |
| Immigrants | Argentina | 40.8 /100 | #186 | Average 98.0% |
| Immigrants | Kazakhstan | 37.1 /100 | #187 | Fair 97.9% |