Pima vs Canadian College, 1 year or more
COMPARE
Pima
Canadian
College, 1 year or more
College, 1 year or more Comparison
Pima
Canadians
45.6%
COLLEGE, 1 YEAR OR MORE
0.0/ 100
METRIC RATING
345th/ 347
METRIC RANK
60.6%
COLLEGE, 1 YEAR OR MORE
82.7/ 100
METRIC RATING
143rd/ 347
METRIC RANK
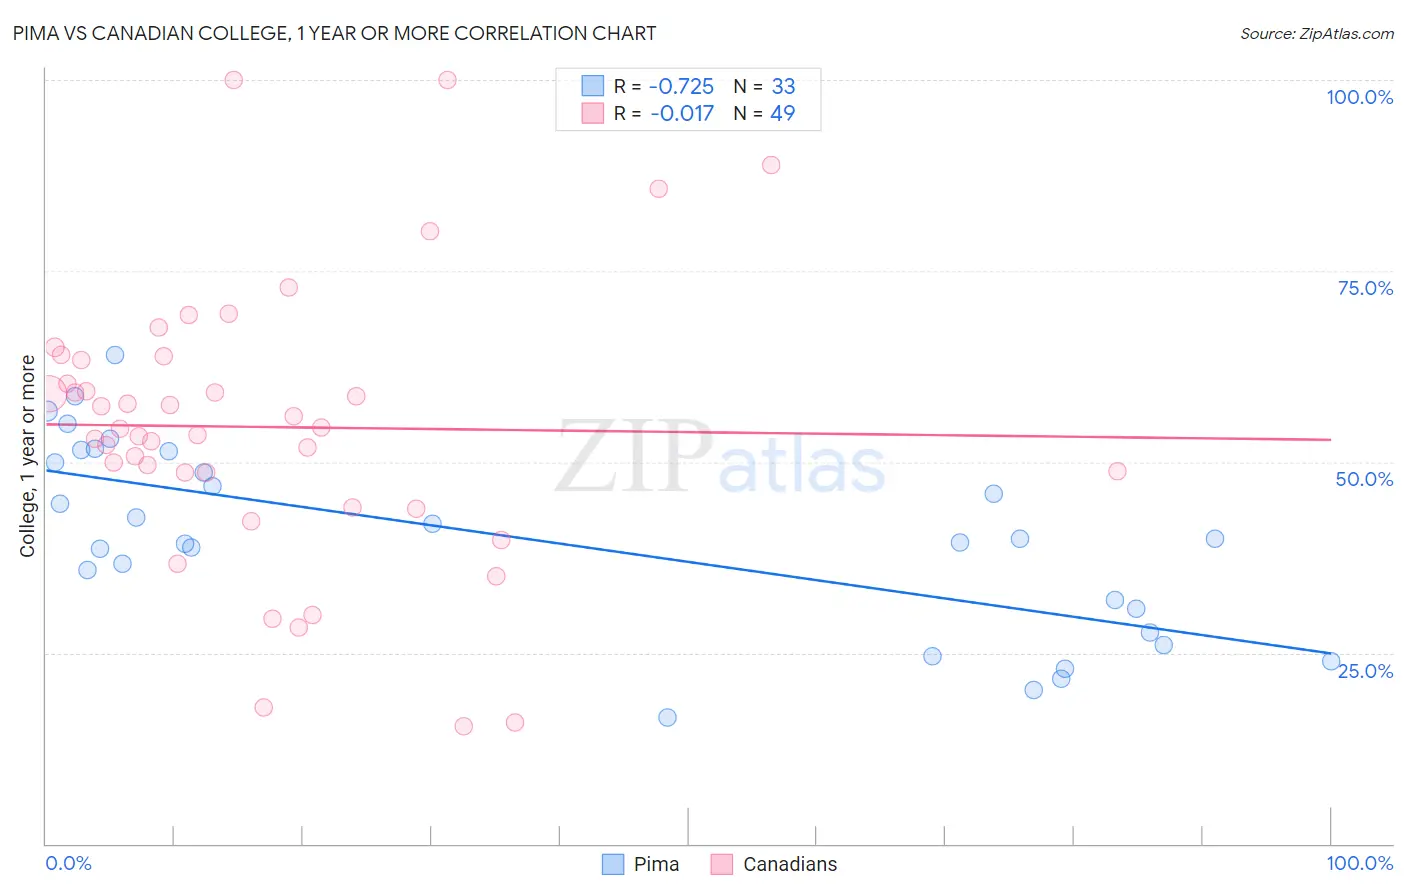
Pima vs Canadian College, 1 year or more Correlation Chart
The statistical analysis conducted on geographies consisting of 61,552,513 people shows a strong negative correlation between the proportion of Pima and percentage of population with at least college, 1 year or more education in the United States with a correlation coefficient (R) of -0.725 and weighted average of 45.6%. Similarly, the statistical analysis conducted on geographies consisting of 437,551,933 people shows no correlation between the proportion of Canadians and percentage of population with at least college, 1 year or more education in the United States with a correlation coefficient (R) of -0.017 and weighted average of 60.6%, a difference of 33.0%.
College, 1 year or more Correlation Summary
| Measurement | Pima | Canadian |
| Minimum | 16.6% | 15.4% |
| Maximum | 64.1% | 100.0% |
| Range | 47.5% | 84.6% |
| Mean | 39.9% | 54.6% |
| Median | 39.9% | 54.3% |
| Interquartile 25% (IQ1) | 29.3% | 46.3% |
| Interquartile 75% (IQ3) | 50.7% | 63.6% |
| Interquartile Range (IQR) | 21.4% | 17.4% |
| Standard Deviation (Sample) | 12.3% | 18.4% |
| Standard Deviation (Population) | 12.2% | 18.2% |
Similar Demographics by College, 1 year or more
Demographics Similar to Pima by College, 1 year or more
In terms of college, 1 year or more, the demographic groups most similar to Pima are Yakama (46.2%, a difference of 1.3%), Tohono O'odham (47.1%, a difference of 3.4%), Inupiat (47.2%, a difference of 3.6%), Immigrants from Mexico (47.5%, a difference of 4.2%), and Immigrants from Cabo Verde (48.1%, a difference of 5.4%).
| Demographics | Rating | Rank | College, 1 year or more |
| Immigrants | Dominican Republic | 0.0 /100 | #333 | Tragic 49.1% |
| Lumbee | 0.0 /100 | #334 | Tragic 48.9% |
| Yuman | 0.0 /100 | #335 | Tragic 48.7% |
| Spanish American Indians | 0.0 /100 | #336 | Tragic 48.5% |
| Pennsylvania Germans | 0.0 /100 | #337 | Tragic 48.5% |
| Immigrants | Central America | 0.0 /100 | #338 | Tragic 48.5% |
| Immigrants | Azores | 0.0 /100 | #339 | Tragic 48.4% |
| Immigrants | Cabo Verde | 0.0 /100 | #340 | Tragic 48.1% |
| Immigrants | Mexico | 0.0 /100 | #341 | Tragic 47.5% |
| Inupiat | 0.0 /100 | #342 | Tragic 47.2% |
| Tohono O'odham | 0.0 /100 | #343 | Tragic 47.1% |
| Yakama | 0.0 /100 | #344 | Tragic 46.2% |
| Pima | 0.0 /100 | #345 | Tragic 45.6% |
| Houma | 0.0 /100 | #346 | Tragic 41.2% |
| Yup'ik | 0.0 /100 | #347 | Tragic 39.4% |
Demographics Similar to Canadians by College, 1 year or more
In terms of college, 1 year or more, the demographic groups most similar to Canadians are Polish (60.7%, a difference of 0.010%), Immigrants from Afghanistan (60.7%, a difference of 0.040%), Iraqi (60.7%, a difference of 0.050%), Czech (60.6%, a difference of 0.080%), and Slavic (60.6%, a difference of 0.14%).
| Demographics | Rating | Rank | College, 1 year or more |
| Basques | 87.2 /100 | #136 | Excellent 60.9% |
| Slovenes | 86.5 /100 | #137 | Excellent 60.9% |
| Taiwanese | 84.3 /100 | #138 | Excellent 60.7% |
| Immigrants | Eritrea | 84.3 /100 | #139 | Excellent 60.7% |
| Iraqis | 83.3 /100 | #140 | Excellent 60.7% |
| Immigrants | Afghanistan | 83.1 /100 | #141 | Excellent 60.7% |
| Poles | 82.8 /100 | #142 | Excellent 60.7% |
| Canadians | 82.7 /100 | #143 | Excellent 60.6% |
| Czechs | 81.9 /100 | #144 | Excellent 60.6% |
| Slavs | 81.1 /100 | #145 | Excellent 60.6% |
| Scottish | 80.2 /100 | #146 | Excellent 60.5% |
| Immigrants | Kenya | 79.1 /100 | #147 | Good 60.5% |
| Kenyans | 79.0 /100 | #148 | Good 60.5% |
| Brazilians | 79.0 /100 | #149 | Good 60.5% |
| Immigrants | Sudan | 77.8 /100 | #150 | Good 60.4% |