Northern European vs Canadian College, 1 year or more
COMPARE
Northern European
Canadian
College, 1 year or more
College, 1 year or more Comparison
Northern Europeans
Canadians
62.9%
COLLEGE, 1 YEAR OR MORE
98.8/ 100
METRIC RATING
79th/ 347
METRIC RANK
60.6%
COLLEGE, 1 YEAR OR MORE
82.7/ 100
METRIC RATING
143rd/ 347
METRIC RANK
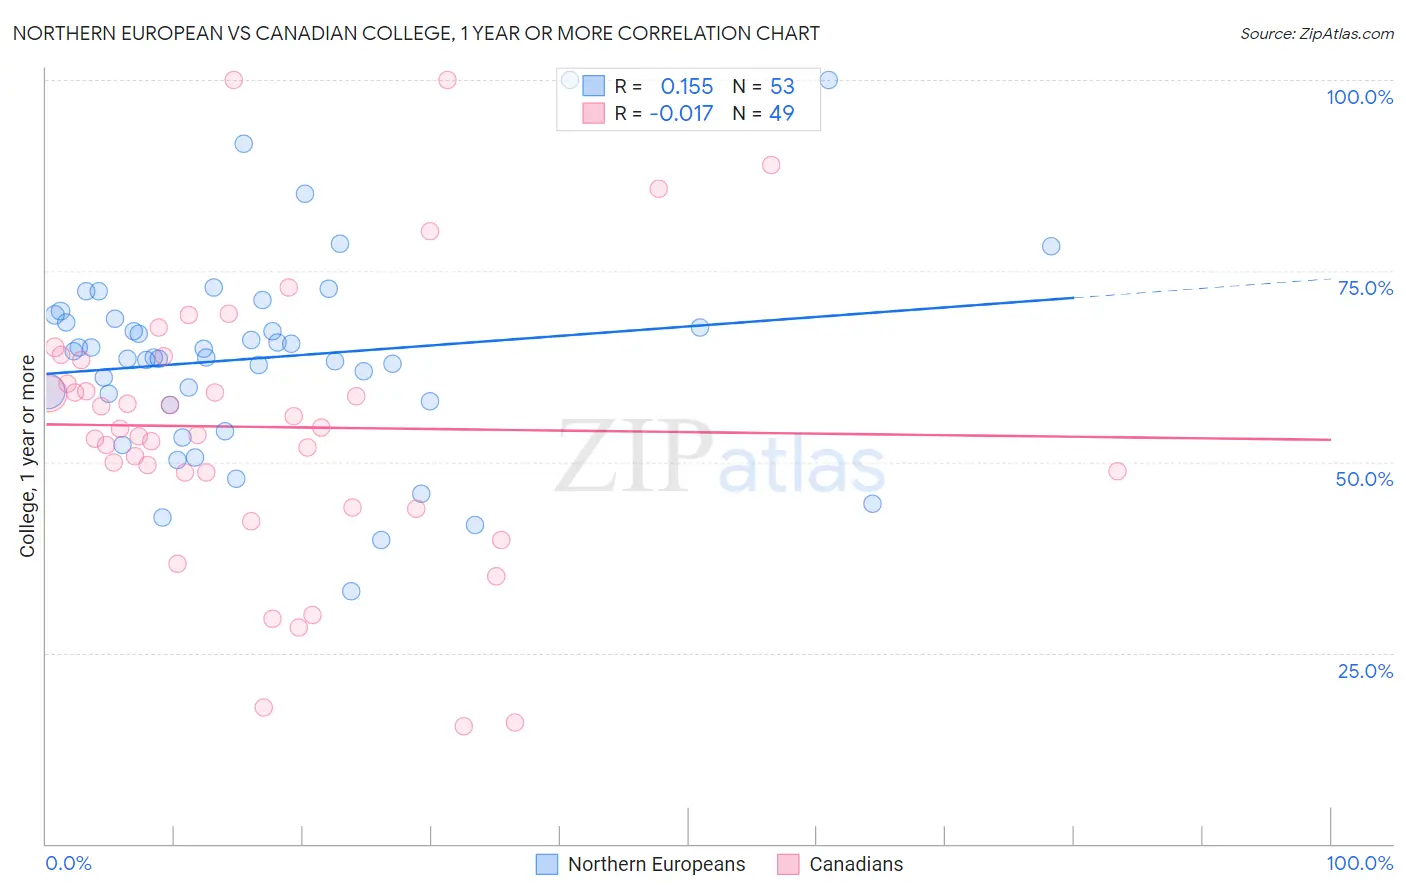
Northern European vs Canadian College, 1 year or more Correlation Chart
The statistical analysis conducted on geographies consisting of 406,096,233 people shows a poor positive correlation between the proportion of Northern Europeans and percentage of population with at least college, 1 year or more education in the United States with a correlation coefficient (R) of 0.155 and weighted average of 62.9%. Similarly, the statistical analysis conducted on geographies consisting of 437,551,933 people shows no correlation between the proportion of Canadians and percentage of population with at least college, 1 year or more education in the United States with a correlation coefficient (R) of -0.017 and weighted average of 60.6%, a difference of 3.7%.
College, 1 year or more Correlation Summary
| Measurement | Northern European | Canadian |
| Minimum | 33.1% | 15.4% |
| Maximum | 100.0% | 100.0% |
| Range | 66.9% | 84.6% |
| Mean | 63.7% | 54.6% |
| Median | 63.7% | 54.3% |
| Interquartile 25% (IQ1) | 57.7% | 46.3% |
| Interquartile 75% (IQ3) | 69.0% | 63.6% |
| Interquartile Range (IQR) | 11.3% | 17.4% |
| Standard Deviation (Sample) | 13.2% | 18.4% |
| Standard Deviation (Population) | 13.1% | 18.2% |
Similar Demographics by College, 1 year or more
Demographics Similar to Northern Europeans by College, 1 year or more
In terms of college, 1 year or more, the demographic groups most similar to Northern Europeans are Immigrants from Lebanon (62.9%, a difference of 0.010%), Paraguayan (62.9%, a difference of 0.030%), Ethiopian (62.9%, a difference of 0.030%), Lithuanian (62.9%, a difference of 0.040%), and Laotian (62.8%, a difference of 0.090%).
| Demographics | Rating | Rank | College, 1 year or more |
| Egyptians | 99.0 /100 | #72 | Exceptional 63.1% |
| Immigrants | Moldova | 99.0 /100 | #73 | Exceptional 63.0% |
| Immigrants | North America | 99.0 /100 | #74 | Exceptional 63.0% |
| Armenians | 98.9 /100 | #75 | Exceptional 63.0% |
| Paraguayans | 98.8 /100 | #76 | Exceptional 62.9% |
| Ethiopians | 98.8 /100 | #77 | Exceptional 62.9% |
| Immigrants | Lebanon | 98.8 /100 | #78 | Exceptional 62.9% |
| Northern Europeans | 98.8 /100 | #79 | Exceptional 62.9% |
| Lithuanians | 98.8 /100 | #80 | Exceptional 62.9% |
| Laotians | 98.7 /100 | #81 | Exceptional 62.8% |
| Immigrants | Bolivia | 98.7 /100 | #82 | Exceptional 62.8% |
| Immigrants | Argentina | 98.6 /100 | #83 | Exceptional 62.8% |
| Immigrants | England | 98.6 /100 | #84 | Exceptional 62.8% |
| Immigrants | Pakistan | 98.6 /100 | #85 | Exceptional 62.8% |
| Immigrants | Western Europe | 98.6 /100 | #86 | Exceptional 62.7% |
Demographics Similar to Canadians by College, 1 year or more
In terms of college, 1 year or more, the demographic groups most similar to Canadians are Polish (60.7%, a difference of 0.010%), Immigrants from Afghanistan (60.7%, a difference of 0.040%), Iraqi (60.7%, a difference of 0.050%), Czech (60.6%, a difference of 0.080%), and Slavic (60.6%, a difference of 0.14%).
| Demographics | Rating | Rank | College, 1 year or more |
| Basques | 87.2 /100 | #136 | Excellent 60.9% |
| Slovenes | 86.5 /100 | #137 | Excellent 60.9% |
| Taiwanese | 84.3 /100 | #138 | Excellent 60.7% |
| Immigrants | Eritrea | 84.3 /100 | #139 | Excellent 60.7% |
| Iraqis | 83.3 /100 | #140 | Excellent 60.7% |
| Immigrants | Afghanistan | 83.1 /100 | #141 | Excellent 60.7% |
| Poles | 82.8 /100 | #142 | Excellent 60.7% |
| Canadians | 82.7 /100 | #143 | Excellent 60.6% |
| Czechs | 81.9 /100 | #144 | Excellent 60.6% |
| Slavs | 81.1 /100 | #145 | Excellent 60.6% |
| Scottish | 80.2 /100 | #146 | Excellent 60.5% |
| Immigrants | Kenya | 79.1 /100 | #147 | Good 60.5% |
| Kenyans | 79.0 /100 | #148 | Good 60.5% |
| Brazilians | 79.0 /100 | #149 | Good 60.5% |
| Immigrants | Sudan | 77.8 /100 | #150 | Good 60.4% |