South American vs Croatian 10th Grade
COMPARE
South American
Croatian
10th Grade
10th Grade Comparison
South Americans
Croatians
92.8%
10TH GRADE
0.9/ 100
METRIC RATING
252nd/ 347
METRIC RANK
95.7%
10TH GRADE
100.0/ 100
METRIC RATING
10th/ 347
METRIC RANK
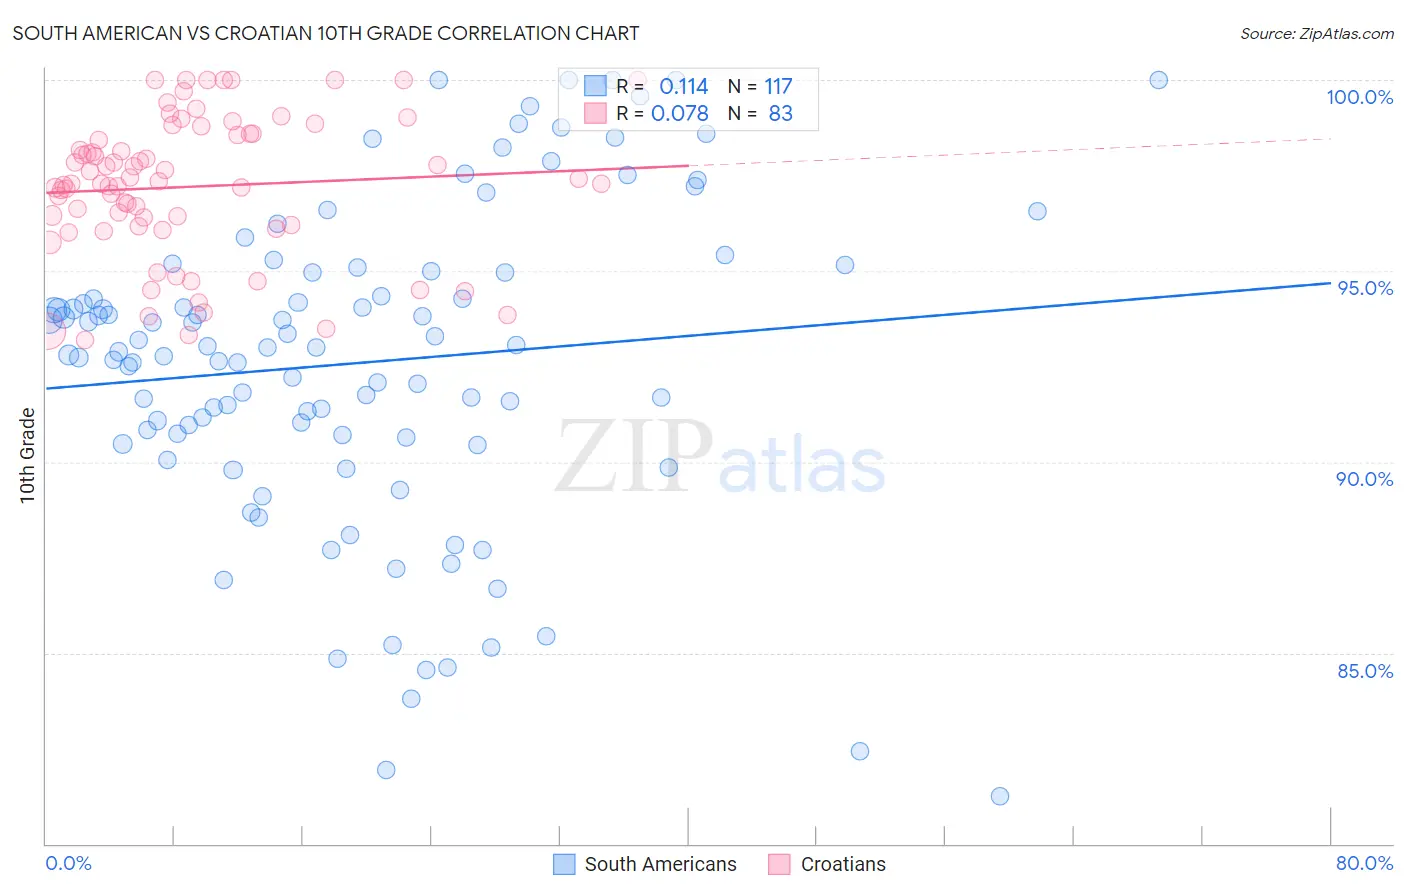
South American vs Croatian 10th Grade Correlation Chart
The statistical analysis conducted on geographies consisting of 494,065,729 people shows a poor positive correlation between the proportion of South Americans and percentage of population with at least 10th grade education in the United States with a correlation coefficient (R) of 0.114 and weighted average of 92.8%. Similarly, the statistical analysis conducted on geographies consisting of 375,734,264 people shows a slight positive correlation between the proportion of Croatians and percentage of population with at least 10th grade education in the United States with a correlation coefficient (R) of 0.078 and weighted average of 95.7%, a difference of 3.2%.
10th Grade Correlation Summary
| Measurement | South American | Croatian |
| Minimum | 81.2% | 93.2% |
| Maximum | 100.0% | 100.0% |
| Range | 18.7% | 6.8% |
| Mean | 92.6% | 97.2% |
| Median | 93.0% | 97.3% |
| Interquartile 25% (IQ1) | 90.7% | 96.2% |
| Interquartile 75% (IQ3) | 95.0% | 98.6% |
| Interquartile Range (IQR) | 4.3% | 2.4% |
| Standard Deviation (Sample) | 4.1% | 1.8% |
| Standard Deviation (Population) | 4.1% | 1.8% |
Similar Demographics by 10th Grade
Demographics Similar to South Americans by 10th Grade
In terms of 10th grade, the demographic groups most similar to South Americans are Ghanaian (92.8%, a difference of 0.0%), Immigrants from Thailand (92.8%, a difference of 0.010%), Armenian (92.7%, a difference of 0.010%), Jamaican (92.8%, a difference of 0.060%), and Immigrants from Bolivia (92.7%, a difference of 0.060%).
| Demographics | Rating | Rank | 10th Grade |
| Uruguayans | 1.8 /100 | #245 | Tragic 92.9% |
| Immigrants | Middle Africa | 1.7 /100 | #246 | Tragic 92.9% |
| Immigrants | Afghanistan | 1.4 /100 | #247 | Tragic 92.8% |
| Colombians | 1.4 /100 | #248 | Tragic 92.8% |
| Immigrants | Senegal | 1.4 /100 | #249 | Tragic 92.8% |
| Jamaicans | 1.2 /100 | #250 | Tragic 92.8% |
| Immigrants | Thailand | 1.0 /100 | #251 | Tragic 92.8% |
| South Americans | 0.9 /100 | #252 | Tragic 92.8% |
| Ghanaians | 0.9 /100 | #253 | Tragic 92.8% |
| Armenians | 0.9 /100 | #254 | Tragic 92.7% |
| Immigrants | Bolivia | 0.7 /100 | #255 | Tragic 92.7% |
| Immigrants | Nigeria | 0.7 /100 | #256 | Tragic 92.7% |
| U.S. Virgin Islanders | 0.7 /100 | #257 | Tragic 92.7% |
| Immigrants | Costa Rica | 0.6 /100 | #258 | Tragic 92.7% |
| Immigrants | Jamaica | 0.5 /100 | #259 | Tragic 92.6% |
Demographics Similar to Croatians by 10th Grade
In terms of 10th grade, the demographic groups most similar to Croatians are Finnish (95.8%, a difference of 0.020%), Danish (95.7%, a difference of 0.040%), Lithuanian (95.8%, a difference of 0.080%), Tlingit-Haida (95.7%, a difference of 0.080%), and German (95.8%, a difference of 0.090%).
| Demographics | Rating | Rank | 10th Grade |
| Slovenes | 100.0 /100 | #3 | Exceptional 95.9% |
| Swedes | 100.0 /100 | #4 | Exceptional 95.9% |
| Carpatho Rusyns | 100.0 /100 | #5 | Exceptional 95.9% |
| Poles | 100.0 /100 | #6 | Exceptional 95.8% |
| Germans | 100.0 /100 | #7 | Exceptional 95.8% |
| Lithuanians | 100.0 /100 | #8 | Exceptional 95.8% |
| Finns | 100.0 /100 | #9 | Exceptional 95.8% |
| Croatians | 100.0 /100 | #10 | Exceptional 95.7% |
| Danes | 100.0 /100 | #11 | Exceptional 95.7% |
| Tlingit-Haida | 100.0 /100 | #12 | Exceptional 95.7% |
| English | 100.0 /100 | #13 | Exceptional 95.6% |
| Tsimshian | 100.0 /100 | #14 | Exceptional 95.6% |
| Irish | 100.0 /100 | #15 | Exceptional 95.6% |
| Scottish | 100.0 /100 | #16 | Exceptional 95.6% |
| Latvians | 100.0 /100 | #17 | Exceptional 95.6% |