South American vs Puerto Rican 10th Grade
COMPARE
South American
Puerto Rican
10th Grade
10th Grade Comparison
South Americans
Puerto Ricans
92.8%
10TH GRADE
0.9/ 100
METRIC RATING
252nd/ 347
METRIC RANK
89.8%
10TH GRADE
0.0/ 100
METRIC RATING
325th/ 347
METRIC RANK
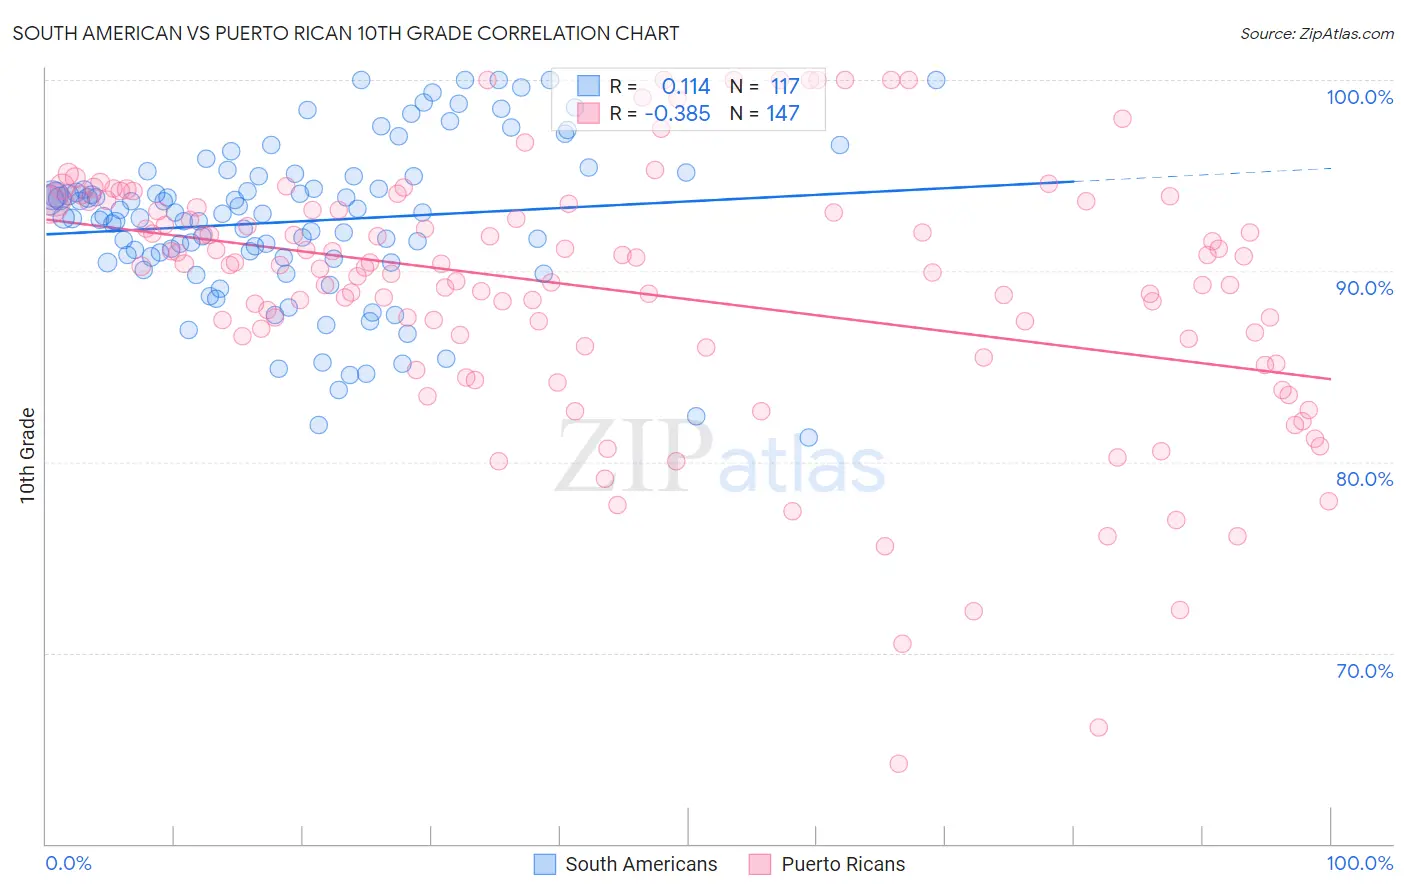
South American vs Puerto Rican 10th Grade Correlation Chart
The statistical analysis conducted on geographies consisting of 494,065,729 people shows a poor positive correlation between the proportion of South Americans and percentage of population with at least 10th grade education in the United States with a correlation coefficient (R) of 0.114 and weighted average of 92.8%. Similarly, the statistical analysis conducted on geographies consisting of 528,320,613 people shows a mild negative correlation between the proportion of Puerto Ricans and percentage of population with at least 10th grade education in the United States with a correlation coefficient (R) of -0.385 and weighted average of 89.8%, a difference of 3.2%.
10th Grade Correlation Summary
| Measurement | South American | Puerto Rican |
| Minimum | 81.2% | 64.2% |
| Maximum | 100.0% | 100.0% |
| Range | 18.7% | 35.8% |
| Mean | 92.6% | 89.0% |
| Median | 93.0% | 90.2% |
| Interquartile 25% (IQ1) | 90.7% | 86.1% |
| Interquartile 75% (IQ3) | 95.0% | 93.3% |
| Interquartile Range (IQR) | 4.3% | 7.3% |
| Standard Deviation (Sample) | 4.1% | 6.7% |
| Standard Deviation (Population) | 4.1% | 6.7% |
Similar Demographics by 10th Grade
Demographics Similar to South Americans by 10th Grade
In terms of 10th grade, the demographic groups most similar to South Americans are Ghanaian (92.8%, a difference of 0.0%), Immigrants from Thailand (92.8%, a difference of 0.010%), Armenian (92.7%, a difference of 0.010%), Jamaican (92.8%, a difference of 0.060%), and Immigrants from Bolivia (92.7%, a difference of 0.060%).
| Demographics | Rating | Rank | 10th Grade |
| Uruguayans | 1.8 /100 | #245 | Tragic 92.9% |
| Immigrants | Middle Africa | 1.7 /100 | #246 | Tragic 92.9% |
| Immigrants | Afghanistan | 1.4 /100 | #247 | Tragic 92.8% |
| Colombians | 1.4 /100 | #248 | Tragic 92.8% |
| Immigrants | Senegal | 1.4 /100 | #249 | Tragic 92.8% |
| Jamaicans | 1.2 /100 | #250 | Tragic 92.8% |
| Immigrants | Thailand | 1.0 /100 | #251 | Tragic 92.8% |
| South Americans | 0.9 /100 | #252 | Tragic 92.8% |
| Ghanaians | 0.9 /100 | #253 | Tragic 92.8% |
| Armenians | 0.9 /100 | #254 | Tragic 92.7% |
| Immigrants | Bolivia | 0.7 /100 | #255 | Tragic 92.7% |
| Immigrants | Nigeria | 0.7 /100 | #256 | Tragic 92.7% |
| U.S. Virgin Islanders | 0.7 /100 | #257 | Tragic 92.7% |
| Immigrants | Costa Rica | 0.6 /100 | #258 | Tragic 92.7% |
| Immigrants | Jamaica | 0.5 /100 | #259 | Tragic 92.6% |
Demographics Similar to Puerto Ricans by 10th Grade
In terms of 10th grade, the demographic groups most similar to Puerto Ricans are Immigrants from Armenia (89.9%, a difference of 0.020%), Central American Indian (89.7%, a difference of 0.18%), Immigrants from Belize (90.1%, a difference of 0.24%), Tohono O'odham (90.1%, a difference of 0.33%), and Belizean (90.2%, a difference of 0.34%).
| Demographics | Rating | Rank | 10th Grade |
| Immigrants | Cuba | 0.0 /100 | #318 | Tragic 90.2% |
| Nicaraguans | 0.0 /100 | #319 | Tragic 90.2% |
| Houma | 0.0 /100 | #320 | Tragic 90.2% |
| Belizeans | 0.0 /100 | #321 | Tragic 90.2% |
| Tohono O'odham | 0.0 /100 | #322 | Tragic 90.1% |
| Immigrants | Belize | 0.0 /100 | #323 | Tragic 90.1% |
| Immigrants | Armenia | 0.0 /100 | #324 | Tragic 89.9% |
| Puerto Ricans | 0.0 /100 | #325 | Tragic 89.8% |
| Central American Indians | 0.0 /100 | #326 | Tragic 89.7% |
| Immigrants | Nicaragua | 0.0 /100 | #327 | Tragic 89.5% |
| Immigrants | Cabo Verde | 0.0 /100 | #328 | Tragic 89.5% |
| Dominicans | 0.0 /100 | #329 | Tragic 89.4% |
| Immigrants | Yemen | 0.0 /100 | #330 | Tragic 89.1% |
| Mexican American Indians | 0.0 /100 | #331 | Tragic 89.0% |
| Immigrants | Azores | 0.0 /100 | #332 | Tragic 89.0% |