South American vs Bhutanese 11th Grade
COMPARE
South American
Bhutanese
11th Grade
11th Grade Comparison
South Americans
Bhutanese
91.6%
11TH GRADE
2.0/ 100
METRIC RATING
240th/ 347
METRIC RANK
94.0%
11TH GRADE
99.8/ 100
METRIC RATING
59th/ 347
METRIC RANK
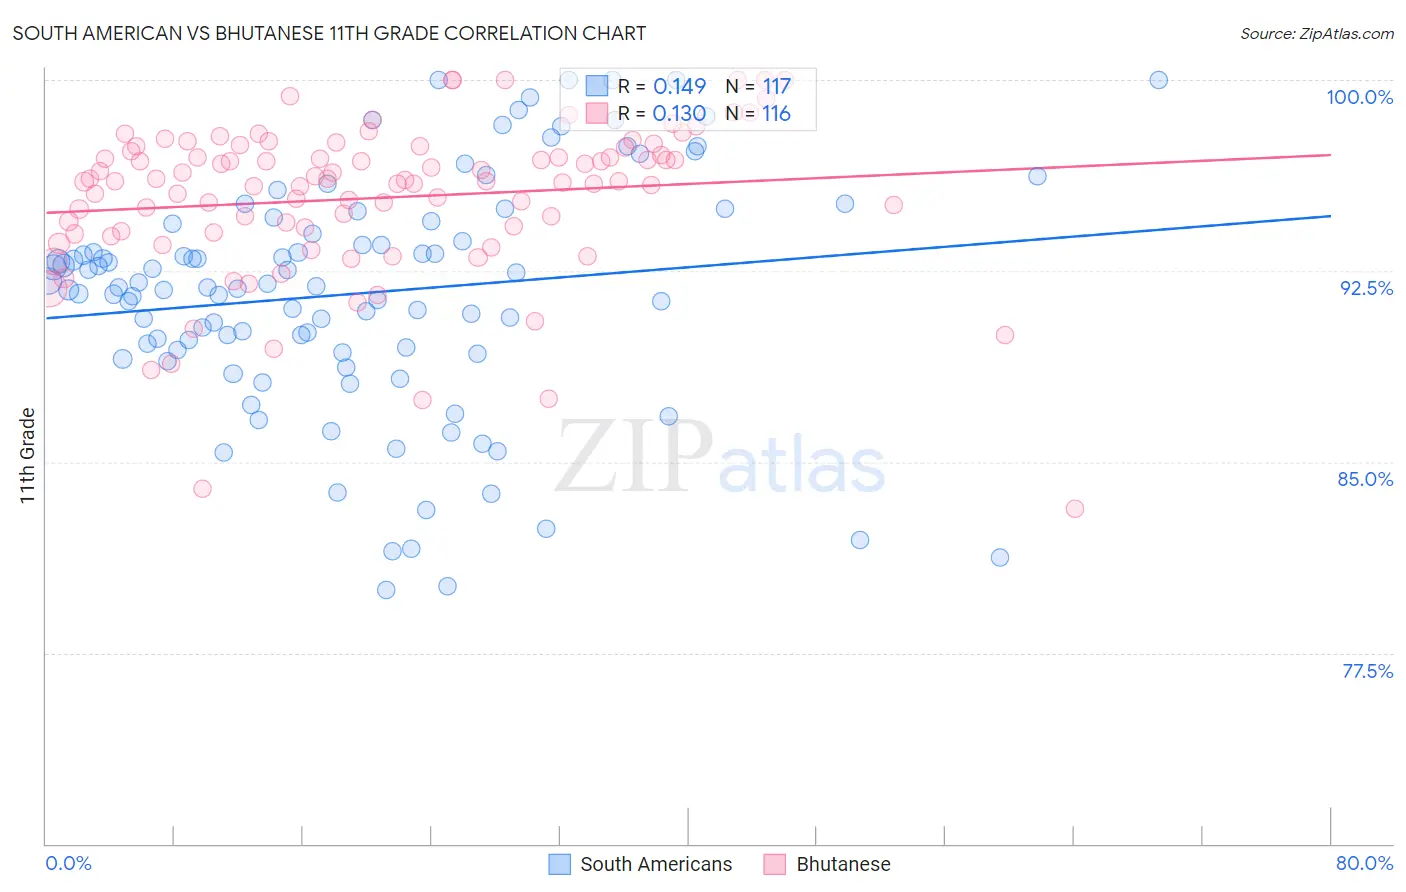
South American vs Bhutanese 11th Grade Correlation Chart
The statistical analysis conducted on geographies consisting of 494,065,729 people shows a poor positive correlation between the proportion of South Americans and percentage of population with at least 11th grade education in the United States with a correlation coefficient (R) of 0.149 and weighted average of 91.6%. Similarly, the statistical analysis conducted on geographies consisting of 455,591,134 people shows a poor positive correlation between the proportion of Bhutanese and percentage of population with at least 11th grade education in the United States with a correlation coefficient (R) of 0.130 and weighted average of 94.0%, a difference of 2.6%.
11th Grade Correlation Summary
| Measurement | South American | Bhutanese |
| Minimum | 80.0% | 83.2% |
| Maximum | 100.0% | 100.0% |
| Range | 20.0% | 16.8% |
| Mean | 91.6% | 95.4% |
| Median | 91.9% | 96.0% |
| Interquartile 25% (IQ1) | 89.4% | 94.0% |
| Interquartile 75% (IQ3) | 94.4% | 97.3% |
| Interquartile Range (IQR) | 5.0% | 3.3% |
| Standard Deviation (Sample) | 4.6% | 3.1% |
| Standard Deviation (Population) | 4.6% | 3.1% |
Similar Demographics by 11th Grade
Demographics Similar to South Americans by 11th Grade
In terms of 11th grade, the demographic groups most similar to South Americans are Bahamian (91.6%, a difference of 0.020%), Immigrants from Middle Africa (91.6%, a difference of 0.050%), Hopi (91.7%, a difference of 0.060%), Comanche (91.7%, a difference of 0.070%), and Immigrants from Thailand (91.6%, a difference of 0.080%).
| Demographics | Rating | Rank | 11th Grade |
| Cheyenne | 3.3 /100 | #233 | Tragic 91.8% |
| Armenians | 2.9 /100 | #234 | Tragic 91.7% |
| Sub-Saharan Africans | 2.9 /100 | #235 | Tragic 91.7% |
| Colombians | 2.8 /100 | #236 | Tragic 91.7% |
| Immigrants | Bolivia | 2.8 /100 | #237 | Tragic 91.7% |
| Comanche | 2.6 /100 | #238 | Tragic 91.7% |
| Hopi | 2.5 /100 | #239 | Tragic 91.7% |
| South Americans | 2.0 /100 | #240 | Tragic 91.6% |
| Bahamians | 1.8 /100 | #241 | Tragic 91.6% |
| Immigrants | Middle Africa | 1.6 /100 | #242 | Tragic 91.6% |
| Immigrants | Thailand | 1.4 /100 | #243 | Tragic 91.6% |
| Senegalese | 1.4 /100 | #244 | Tragic 91.6% |
| Africans | 1.3 /100 | #245 | Tragic 91.5% |
| Seminole | 1.2 /100 | #246 | Tragic 91.5% |
| Immigrants | Philippines | 1.0 /100 | #247 | Tragic 91.5% |
Demographics Similar to Bhutanese by 11th Grade
In terms of 11th grade, the demographic groups most similar to Bhutanese are French Canadian (94.0%, a difference of 0.0%), New Zealander (94.0%, a difference of 0.0%), Iranian (94.0%, a difference of 0.0%), Okinawan (94.0%, a difference of 0.0%), and Immigrants from North America (94.0%, a difference of 0.010%).
| Demographics | Rating | Rank | 11th Grade |
| Immigrants | Canada | 99.9 /100 | #52 | Exceptional 94.0% |
| Immigrants | Australia | 99.9 /100 | #53 | Exceptional 94.0% |
| Immigrants | North America | 99.9 /100 | #54 | Exceptional 94.0% |
| Czechoslovakians | 99.9 /100 | #55 | Exceptional 94.0% |
| French Canadians | 99.9 /100 | #56 | Exceptional 94.0% |
| New Zealanders | 99.9 /100 | #57 | Exceptional 94.0% |
| Iranians | 99.9 /100 | #58 | Exceptional 94.0% |
| Bhutanese | 99.8 /100 | #59 | Exceptional 94.0% |
| Okinawans | 99.8 /100 | #60 | Exceptional 94.0% |
| Immigrants | Belgium | 99.8 /100 | #61 | Exceptional 94.0% |
| Austrians | 99.8 /100 | #62 | Exceptional 94.0% |
| Ukrainians | 99.8 /100 | #63 | Exceptional 94.0% |
| Immigrants | Sweden | 99.8 /100 | #64 | Exceptional 93.9% |
| Native Hawaiians | 99.8 /100 | #65 | Exceptional 93.9% |
| Alaskan Athabascans | 99.8 /100 | #66 | Exceptional 93.9% |