South American vs Immigrants from Afghanistan 3rd Grade
COMPARE
South American
Immigrants from Afghanistan
3rd Grade
3rd Grade Comparison
South Americans
Immigrants from Afghanistan
97.4%
3RD GRADE
0.9/ 100
METRIC RATING
249th/ 347
METRIC RANK
97.0%
3RD GRADE
0.0/ 100
METRIC RATING
291st/ 347
METRIC RANK
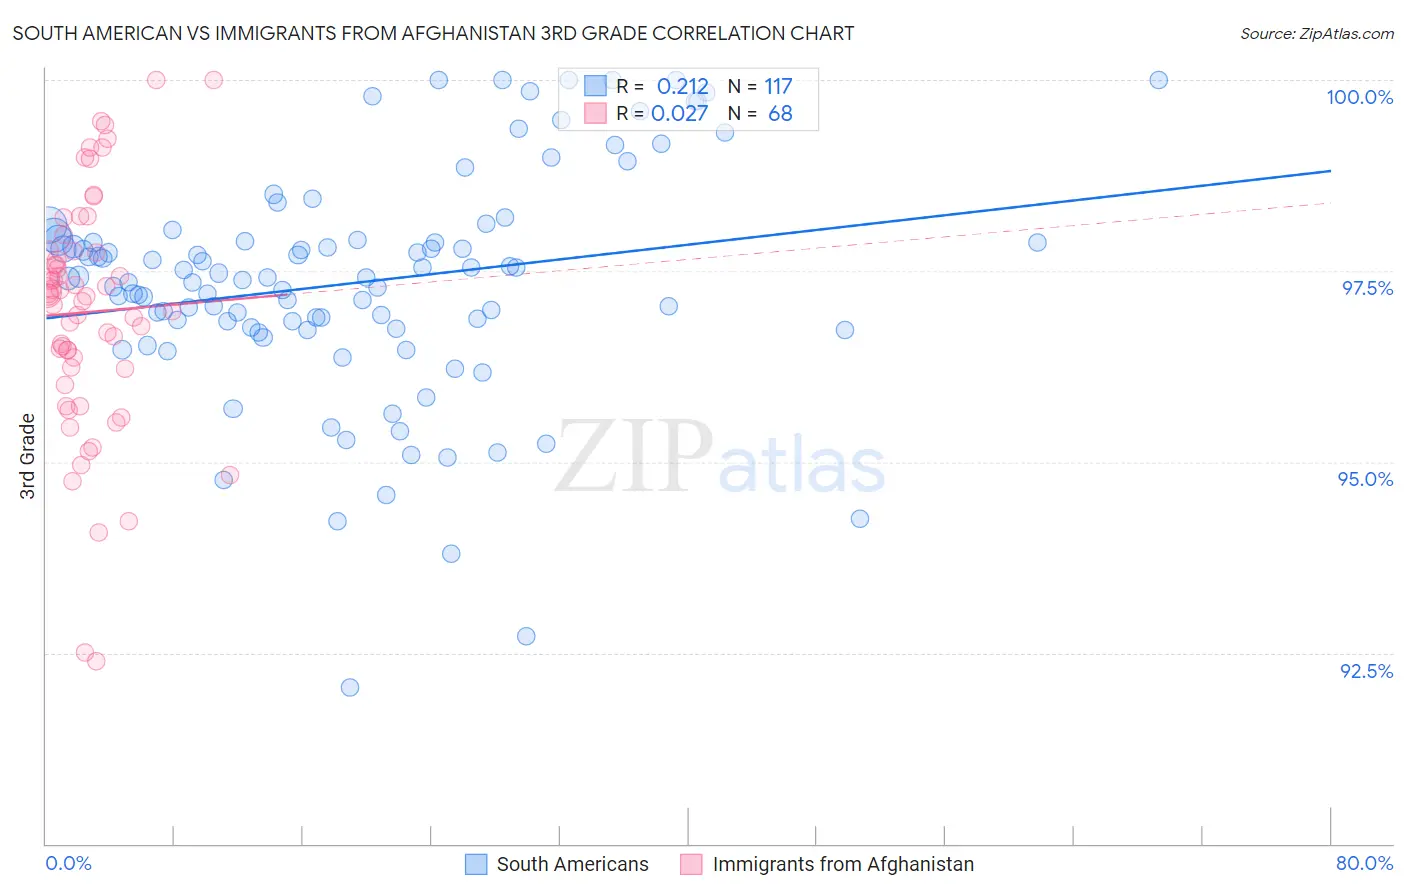
South American vs Immigrants from Afghanistan 3rd Grade Correlation Chart
The statistical analysis conducted on geographies consisting of 494,178,447 people shows a weak positive correlation between the proportion of South Americans and percentage of population with at least 3rd grade education in the United States with a correlation coefficient (R) of 0.212 and weighted average of 97.4%. Similarly, the statistical analysis conducted on geographies consisting of 147,629,924 people shows no correlation between the proportion of Immigrants from Afghanistan and percentage of population with at least 3rd grade education in the United States with a correlation coefficient (R) of 0.027 and weighted average of 97.0%, a difference of 0.34%.
3rd Grade Correlation Summary
| Measurement | South American | Immigrants from Afghanistan |
| Minimum | 92.1% | 92.4% |
| Maximum | 100.0% | 100.0% |
| Range | 7.9% | 7.6% |
| Mean | 97.3% | 97.0% |
| Median | 97.4% | 97.2% |
| Interquartile 25% (IQ1) | 96.8% | 96.2% |
| Interquartile 75% (IQ3) | 97.9% | 97.7% |
| Interquartile Range (IQR) | 1.2% | 1.5% |
| Standard Deviation (Sample) | 1.5% | 1.5% |
| Standard Deviation (Population) | 1.5% | 1.5% |
Similar Demographics by 3rd Grade
Demographics Similar to South Americans by 3rd Grade
In terms of 3rd grade, the demographic groups most similar to South Americans are Immigrants from Eastern Africa (97.4%, a difference of 0.0%), Immigrants from Senegal (97.4%, a difference of 0.010%), Assyrian/Chaldean/Syriac (97.4%, a difference of 0.010%), Immigrants from Middle Africa (97.4%, a difference of 0.010%), and Immigrants from Asia (97.4%, a difference of 0.010%).
| Demographics | Rating | Rank | 3rd Grade |
| Koreans | 1.3 /100 | #242 | Tragic 97.4% |
| Indians (Asian) | 1.3 /100 | #243 | Tragic 97.4% |
| Asians | 1.1 /100 | #244 | Tragic 97.4% |
| Ethiopians | 1.1 /100 | #245 | Tragic 97.4% |
| Immigrants | Senegal | 1.0 /100 | #246 | Tragic 97.4% |
| Assyrians/Chaldeans/Syriacs | 1.0 /100 | #247 | Tragic 97.4% |
| Immigrants | Eastern Africa | 0.9 /100 | #248 | Tragic 97.4% |
| South Americans | 0.9 /100 | #249 | Tragic 97.4% |
| Immigrants | Middle Africa | 0.9 /100 | #250 | Tragic 97.4% |
| Immigrants | Asia | 0.8 /100 | #251 | Tragic 97.4% |
| Peruvians | 0.8 /100 | #252 | Tragic 97.4% |
| Immigrants | Africa | 0.8 /100 | #253 | Tragic 97.4% |
| Jamaicans | 0.7 /100 | #254 | Tragic 97.4% |
| Bolivians | 0.6 /100 | #255 | Tragic 97.3% |
| Immigrants | Congo | 0.6 /100 | #256 | Tragic 97.3% |
Demographics Similar to Immigrants from Afghanistan by 3rd Grade
In terms of 3rd grade, the demographic groups most similar to Immigrants from Afghanistan are Immigrants from Portugal (97.0%, a difference of 0.0%), British West Indian (97.0%, a difference of 0.010%), Immigrants from West Indies (97.1%, a difference of 0.040%), Immigrants from Thailand (97.1%, a difference of 0.040%), and Immigrants from Grenada (97.0%, a difference of 0.040%).
| Demographics | Rating | Rank | 3rd Grade |
| Immigrants | Trinidad and Tobago | 0.0 /100 | #284 | Tragic 97.1% |
| Immigrants | Hong Kong | 0.0 /100 | #285 | Tragic 97.1% |
| Immigrants | Barbados | 0.0 /100 | #286 | Tragic 97.1% |
| Immigrants | St. Vincent and the Grenadines | 0.0 /100 | #287 | Tragic 97.1% |
| Immigrants | West Indies | 0.0 /100 | #288 | Tragic 97.1% |
| Immigrants | Thailand | 0.0 /100 | #289 | Tragic 97.1% |
| Immigrants | Portugal | 0.0 /100 | #290 | Tragic 97.0% |
| Immigrants | Afghanistan | 0.0 /100 | #291 | Tragic 97.0% |
| British West Indians | 0.0 /100 | #292 | Tragic 97.0% |
| Immigrants | Grenada | 0.0 /100 | #293 | Tragic 97.0% |
| Malaysians | 0.0 /100 | #294 | Tragic 97.0% |
| Immigrants | Eritrea | 0.0 /100 | #295 | Tragic 97.0% |
| Immigrants | Immigrants | 0.0 /100 | #296 | Tragic 96.9% |
| Haitians | 0.0 /100 | #297 | Tragic 96.9% |
| Immigrants | Dominica | 0.0 /100 | #298 | Tragic 96.9% |