South American vs Blackfeet 11th Grade
COMPARE
South American
Blackfeet
11th Grade
11th Grade Comparison
South Americans
Blackfeet
91.6%
11TH GRADE
2.0/ 100
METRIC RATING
240th/ 347
METRIC RANK
92.0%
11TH GRADE
10.1/ 100
METRIC RATING
218th/ 347
METRIC RANK
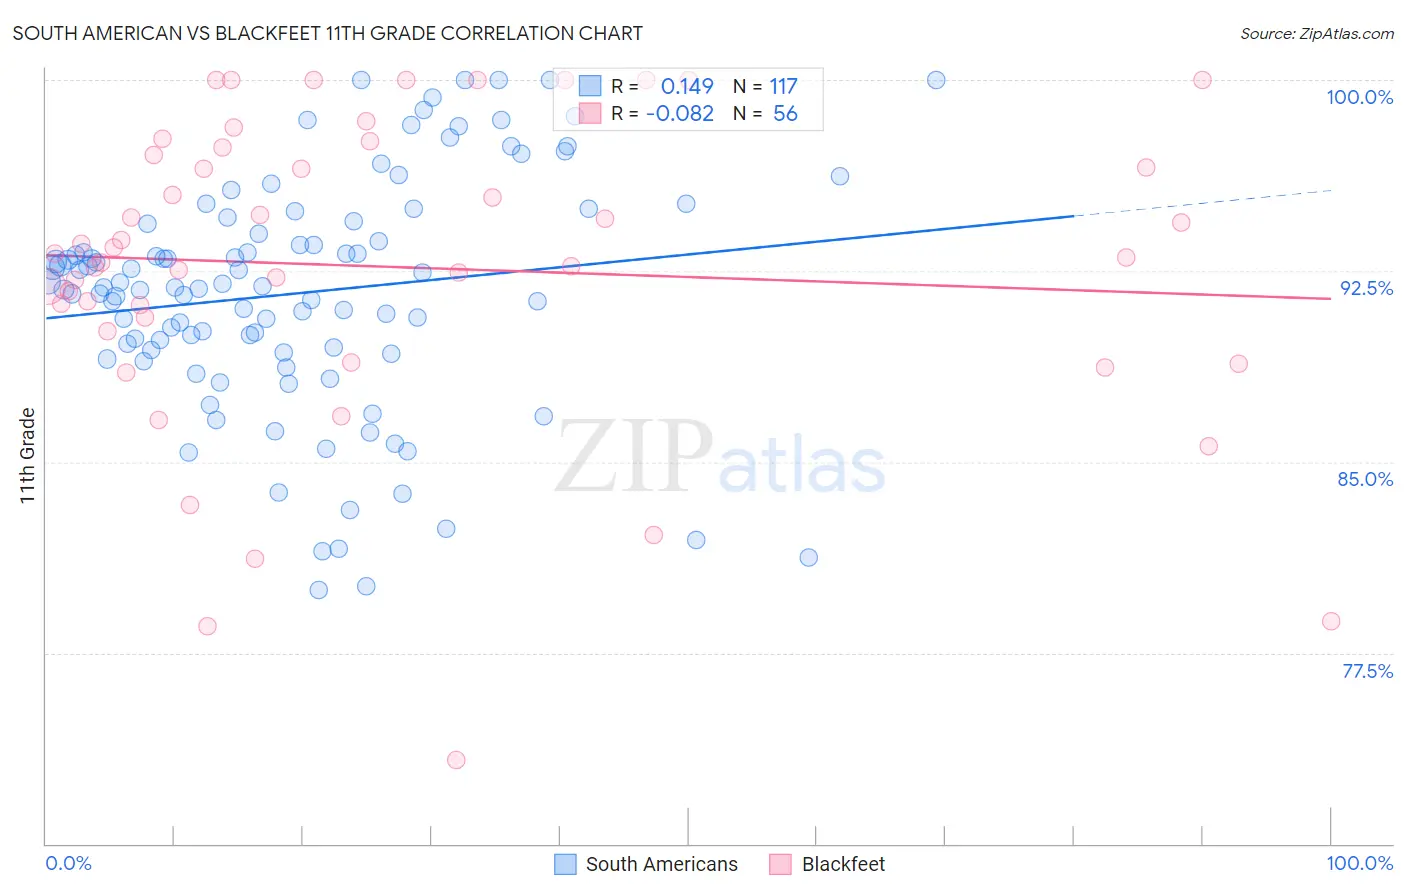
South American vs Blackfeet 11th Grade Correlation Chart
The statistical analysis conducted on geographies consisting of 494,065,729 people shows a poor positive correlation between the proportion of South Americans and percentage of population with at least 11th grade education in the United States with a correlation coefficient (R) of 0.149 and weighted average of 91.6%. Similarly, the statistical analysis conducted on geographies consisting of 309,582,133 people shows a slight negative correlation between the proportion of Blackfeet and percentage of population with at least 11th grade education in the United States with a correlation coefficient (R) of -0.082 and weighted average of 92.0%, a difference of 0.43%.
11th Grade Correlation Summary
| Measurement | South American | Blackfeet |
| Minimum | 80.0% | 73.3% |
| Maximum | 100.0% | 100.0% |
| Range | 20.0% | 26.7% |
| Mean | 91.6% | 92.7% |
| Median | 91.9% | 93.1% |
| Interquartile 25% (IQ1) | 89.4% | 90.4% |
| Interquartile 75% (IQ3) | 94.4% | 97.2% |
| Interquartile Range (IQR) | 5.0% | 6.8% |
| Standard Deviation (Sample) | 4.6% | 6.1% |
| Standard Deviation (Population) | 4.6% | 6.0% |
Similar Demographics by 11th Grade
Demographics Similar to South Americans by 11th Grade
In terms of 11th grade, the demographic groups most similar to South Americans are Bahamian (91.6%, a difference of 0.020%), Immigrants from Middle Africa (91.6%, a difference of 0.050%), Hopi (91.7%, a difference of 0.060%), Comanche (91.7%, a difference of 0.070%), and Immigrants from Thailand (91.6%, a difference of 0.080%).
| Demographics | Rating | Rank | 11th Grade |
| Cheyenne | 3.3 /100 | #233 | Tragic 91.8% |
| Armenians | 2.9 /100 | #234 | Tragic 91.7% |
| Sub-Saharan Africans | 2.9 /100 | #235 | Tragic 91.7% |
| Colombians | 2.8 /100 | #236 | Tragic 91.7% |
| Immigrants | Bolivia | 2.8 /100 | #237 | Tragic 91.7% |
| Comanche | 2.6 /100 | #238 | Tragic 91.7% |
| Hopi | 2.5 /100 | #239 | Tragic 91.7% |
| South Americans | 2.0 /100 | #240 | Tragic 91.6% |
| Bahamians | 1.8 /100 | #241 | Tragic 91.6% |
| Immigrants | Middle Africa | 1.6 /100 | #242 | Tragic 91.6% |
| Immigrants | Thailand | 1.4 /100 | #243 | Tragic 91.6% |
| Senegalese | 1.4 /100 | #244 | Tragic 91.6% |
| Africans | 1.3 /100 | #245 | Tragic 91.5% |
| Seminole | 1.2 /100 | #246 | Tragic 91.5% |
| Immigrants | Philippines | 1.0 /100 | #247 | Tragic 91.5% |
Demographics Similar to Blackfeet by 11th Grade
In terms of 11th grade, the demographic groups most similar to Blackfeet are Portuguese (92.0%, a difference of 0.0%), Immigrants from Sierra Leone (92.0%, a difference of 0.030%), Somali (92.1%, a difference of 0.040%), Immigrants from Southern Europe (92.1%, a difference of 0.060%), and Afghan (92.1%, a difference of 0.070%).
| Demographics | Rating | Rank | 11th Grade |
| Immigrants | Micronesia | 17.7 /100 | #211 | Poor 92.2% |
| Koreans | 14.4 /100 | #212 | Poor 92.1% |
| Immigrants | Ethiopia | 13.9 /100 | #213 | Poor 92.1% |
| Afghans | 12.8 /100 | #214 | Poor 92.1% |
| Immigrants | Southern Europe | 12.5 /100 | #215 | Poor 92.1% |
| Somalis | 11.6 /100 | #216 | Poor 92.1% |
| Immigrants | Sierra Leone | 11.1 /100 | #217 | Poor 92.0% |
| Blackfeet | 10.1 /100 | #218 | Poor 92.0% |
| Portuguese | 10.0 /100 | #219 | Tragic 92.0% |
| South American Indians | 7.6 /100 | #220 | Tragic 92.0% |
| Immigrants | Liberia | 7.0 /100 | #221 | Tragic 91.9% |
| Immigrants | Africa | 6.5 /100 | #222 | Tragic 91.9% |
| Immigrants | Bahamas | 6.5 /100 | #223 | Tragic 91.9% |
| Costa Ricans | 6.3 /100 | #224 | Tragic 91.9% |
| Immigrants | Zaire | 5.4 /100 | #225 | Tragic 91.9% |