South African vs Guyanese High School Diploma
COMPARE
South African
Guyanese
High School Diploma
High School Diploma Comparison
South Africans
Guyanese
90.6%
HIGH SCHOOL DIPLOMA
98.6/ 100
METRIC RATING
91st/ 347
METRIC RANK
85.5%
HIGH SCHOOL DIPLOMA
0.0/ 100
METRIC RATING
299th/ 347
METRIC RANK
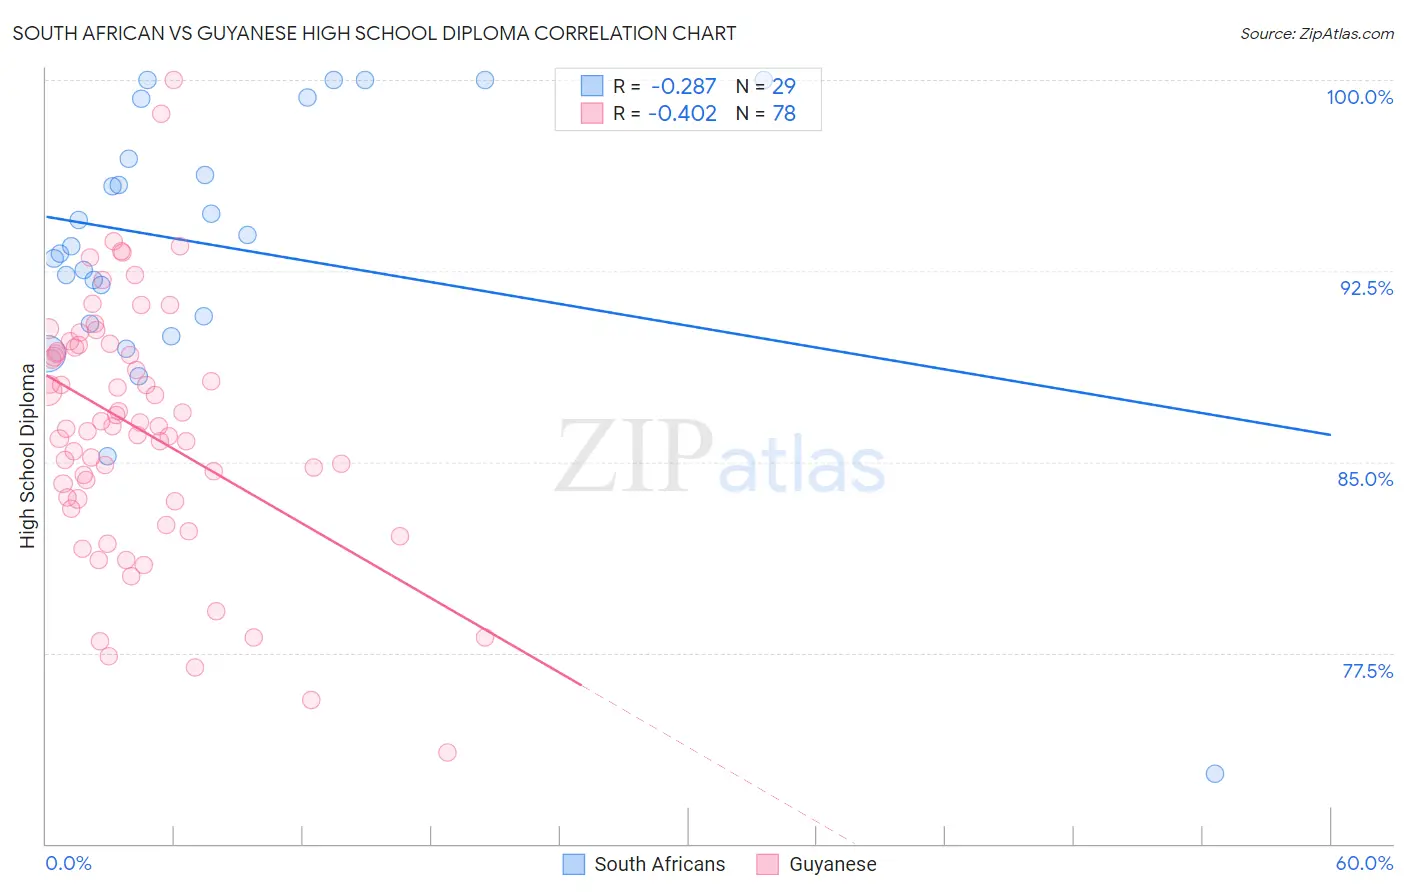
South African vs Guyanese High School Diploma Correlation Chart
The statistical analysis conducted on geographies consisting of 182,604,532 people shows a weak negative correlation between the proportion of South Africans and percentage of population with at least high school diploma education in the United States with a correlation coefficient (R) of -0.287 and weighted average of 90.6%. Similarly, the statistical analysis conducted on geographies consisting of 176,933,658 people shows a moderate negative correlation between the proportion of Guyanese and percentage of population with at least high school diploma education in the United States with a correlation coefficient (R) of -0.402 and weighted average of 85.5%, a difference of 6.0%.
High School Diploma Correlation Summary
| Measurement | South African | Guyanese |
| Minimum | 72.7% | 73.6% |
| Maximum | 100.0% | 100.0% |
| Range | 27.3% | 26.4% |
| Mean | 93.5% | 86.3% |
| Median | 93.5% | 86.4% |
| Interquartile 25% (IQ1) | 90.6% | 83.5% |
| Interquartile 75% (IQ3) | 98.1% | 89.5% |
| Interquartile Range (IQR) | 7.5% | 6.0% |
| Standard Deviation (Sample) | 5.7% | 4.9% |
| Standard Deviation (Population) | 5.6% | 4.9% |
Similar Demographics by High School Diploma
Demographics Similar to South Africans by High School Diploma
In terms of high school diploma, the demographic groups most similar to South Africans are Swiss (90.6%, a difference of 0.010%), Celtic (90.6%, a difference of 0.020%), Immigrants from Western Europe (90.6%, a difference of 0.020%), Canadian (90.6%, a difference of 0.030%), and Immigrants from Israel (90.5%, a difference of 0.040%).
| Demographics | Rating | Rank | High School Diploma |
| Immigrants | Saudi Arabia | 99.1 /100 | #84 | Exceptional 90.7% |
| Romanians | 98.9 /100 | #85 | Exceptional 90.7% |
| Immigrants | Bulgaria | 98.9 /100 | #86 | Exceptional 90.6% |
| Immigrants | Turkey | 98.9 /100 | #87 | Exceptional 90.6% |
| Immigrants | France | 98.8 /100 | #88 | Exceptional 90.6% |
| Canadians | 98.7 /100 | #89 | Exceptional 90.6% |
| Celtics | 98.7 /100 | #90 | Exceptional 90.6% |
| South Africans | 98.6 /100 | #91 | Exceptional 90.6% |
| Swiss | 98.6 /100 | #92 | Exceptional 90.6% |
| Immigrants | Western Europe | 98.6 /100 | #93 | Exceptional 90.6% |
| Immigrants | Israel | 98.5 /100 | #94 | Exceptional 90.5% |
| Icelanders | 98.5 /100 | #95 | Exceptional 90.5% |
| Immigrants | Serbia | 98.4 /100 | #96 | Exceptional 90.5% |
| Immigrants | Kuwait | 98.3 /100 | #97 | Exceptional 90.5% |
| Immigrants | Korea | 98.3 /100 | #98 | Exceptional 90.5% |
Demographics Similar to Guyanese by High School Diploma
In terms of high school diploma, the demographic groups most similar to Guyanese are Immigrants from Bangladesh (85.5%, a difference of 0.020%), Vietnamese (85.4%, a difference of 0.040%), Immigrants from Haiti (85.4%, a difference of 0.080%), Cuban (85.4%, a difference of 0.080%), and Native/Alaskan (85.6%, a difference of 0.10%).
| Demographics | Rating | Rank | High School Diploma |
| Japanese | 0.0 /100 | #292 | Tragic 85.9% |
| British West Indians | 0.0 /100 | #293 | Tragic 85.9% |
| Immigrants | Fiji | 0.0 /100 | #294 | Tragic 85.8% |
| Immigrants | Immigrants | 0.0 /100 | #295 | Tragic 85.8% |
| Immigrants | Cambodia | 0.0 /100 | #296 | Tragic 85.6% |
| Immigrants | Grenada | 0.0 /100 | #297 | Tragic 85.6% |
| Natives/Alaskans | 0.0 /100 | #298 | Tragic 85.6% |
| Guyanese | 0.0 /100 | #299 | Tragic 85.5% |
| Immigrants | Bangladesh | 0.0 /100 | #300 | Tragic 85.5% |
| Vietnamese | 0.0 /100 | #301 | Tragic 85.4% |
| Immigrants | Haiti | 0.0 /100 | #302 | Tragic 85.4% |
| Cubans | 0.0 /100 | #303 | Tragic 85.4% |
| Nepalese | 0.0 /100 | #304 | Tragic 85.3% |
| Immigrants | Portugal | 0.0 /100 | #305 | Tragic 85.3% |
| Immigrants | Guyana | 0.0 /100 | #306 | Tragic 85.3% |