Somali vs White/Caucasian College, Under 1 year
COMPARE
Somali
White/Caucasian
College, Under 1 year
College, Under 1 year Comparison
Somalis
Whites/Caucasians
65.8%
COLLEGE, UNDER 1 YEAR
62.7/ 100
METRIC RATING
163rd/ 347
METRIC RANK
64.0%
COLLEGE, UNDER 1 YEAR
12.8/ 100
METRIC RATING
206th/ 347
METRIC RANK
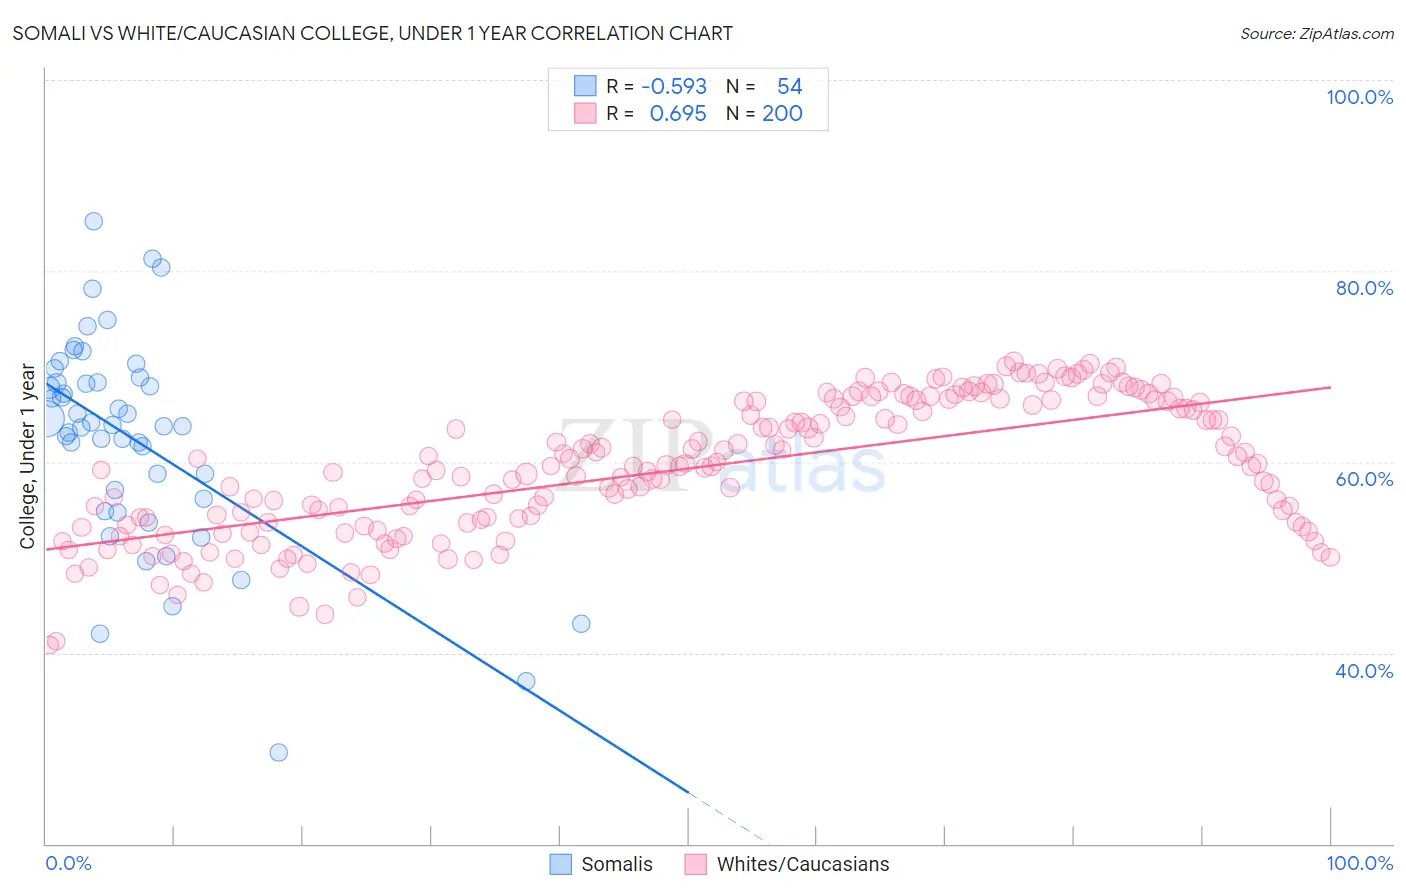
Somali vs White/Caucasian College, Under 1 year Correlation Chart
The statistical analysis conducted on geographies consisting of 99,332,457 people shows a substantial negative correlation between the proportion of Somalis and percentage of population with at least college, under 1 year education in the United States with a correlation coefficient (R) of -0.593 and weighted average of 65.8%. Similarly, the statistical analysis conducted on geographies consisting of 585,196,382 people shows a significant positive correlation between the proportion of Whites/Caucasians and percentage of population with at least college, under 1 year education in the United States with a correlation coefficient (R) of 0.695 and weighted average of 64.0%, a difference of 2.7%.
College, Under 1 year Correlation Summary
| Measurement | Somali | White/Caucasian |
| Minimum | 29.5% | 40.8% |
| Maximum | 85.2% | 70.5% |
| Range | 55.6% | 29.7% |
| Mean | 62.4% | 59.3% |
| Median | 63.8% | 59.6% |
| Interquartile 25% (IQ1) | 56.1% | 53.5% |
| Interquartile 75% (IQ3) | 68.3% | 66.3% |
| Interquartile Range (IQR) | 12.2% | 12.8% |
| Standard Deviation (Sample) | 10.9% | 7.1% |
| Standard Deviation (Population) | 10.8% | 7.1% |
Similar Demographics by College, Under 1 year
Demographics Similar to Somalis by College, Under 1 year
In terms of college, under 1 year, the demographic groups most similar to Somalis are Czechoslovakian (65.8%, a difference of 0.010%), Immigrants from Uzbekistan (65.8%, a difference of 0.050%), Korean (65.9%, a difference of 0.12%), Albanian (65.9%, a difference of 0.16%), and Brazilian (65.9%, a difference of 0.16%).
| Demographics | Rating | Rank | College, Under 1 year |
| Welsh | 69.9 /100 | #156 | Good 66.0% |
| Sierra Leoneans | 67.8 /100 | #157 | Good 66.0% |
| Celtics | 67.3 /100 | #158 | Good 65.9% |
| Tlingit-Haida | 66.4 /100 | #159 | Good 65.9% |
| Albanians | 66.1 /100 | #160 | Good 65.9% |
| Brazilians | 66.0 /100 | #161 | Good 65.9% |
| Koreans | 65.3 /100 | #162 | Good 65.9% |
| Somalis | 62.7 /100 | #163 | Good 65.8% |
| Czechoslovakians | 62.6 /100 | #164 | Good 65.8% |
| Immigrants | Uzbekistan | 61.6 /100 | #165 | Good 65.8% |
| Moroccans | 56.7 /100 | #166 | Average 65.6% |
| Immigrants | Somalia | 56.4 /100 | #167 | Average 65.6% |
| Hungarians | 55.9 /100 | #168 | Average 65.6% |
| Yugoslavians | 55.7 /100 | #169 | Average 65.6% |
| Germans | 55.7 /100 | #170 | Average 65.6% |
Demographics Similar to Whites/Caucasians by College, Under 1 year
In terms of college, under 1 year, the demographic groups most similar to Whites/Caucasians are Colombian (64.0%, a difference of 0.040%), Immigrants from Vietnam (64.0%, a difference of 0.070%), Peruvian (64.1%, a difference of 0.090%), Puget Sound Salish (63.9%, a difference of 0.16%), and Immigrants from Zaire (64.1%, a difference of 0.17%).
| Demographics | Rating | Rank | College, Under 1 year |
| Panamanians | 17.0 /100 | #199 | Poor 64.3% |
| Nigerians | 16.7 /100 | #200 | Poor 64.3% |
| French Canadians | 16.3 /100 | #201 | Poor 64.2% |
| South Americans | 16.2 /100 | #202 | Poor 64.2% |
| Uruguayans | 15.6 /100 | #203 | Poor 64.2% |
| Immigrants | Zaire | 14.6 /100 | #204 | Poor 64.1% |
| Peruvians | 13.7 /100 | #205 | Poor 64.1% |
| Whites/Caucasians | 12.8 /100 | #206 | Poor 64.0% |
| Colombians | 12.4 /100 | #207 | Poor 64.0% |
| Immigrants | Vietnam | 12.1 /100 | #208 | Poor 64.0% |
| Puget Sound Salish | 11.3 /100 | #209 | Poor 63.9% |
| Ghanaians | 11.2 /100 | #210 | Poor 63.9% |
| Native Hawaiians | 10.6 /100 | #211 | Poor 63.9% |
| Immigrants | Middle Africa | 10.5 /100 | #212 | Poor 63.9% |
| Immigrants | South America | 9.1 /100 | #213 | Tragic 63.8% |