Hispanic or Latino vs White/Caucasian College, Under 1 year
COMPARE
Hispanic or Latino
White/Caucasian
College, Under 1 year
College, Under 1 year Comparison
Hispanics or Latinos
Whites/Caucasians
57.0%
COLLEGE, UNDER 1 YEAR
0.0/ 100
METRIC RATING
317th/ 347
METRIC RANK
64.0%
COLLEGE, UNDER 1 YEAR
12.8/ 100
METRIC RATING
206th/ 347
METRIC RANK
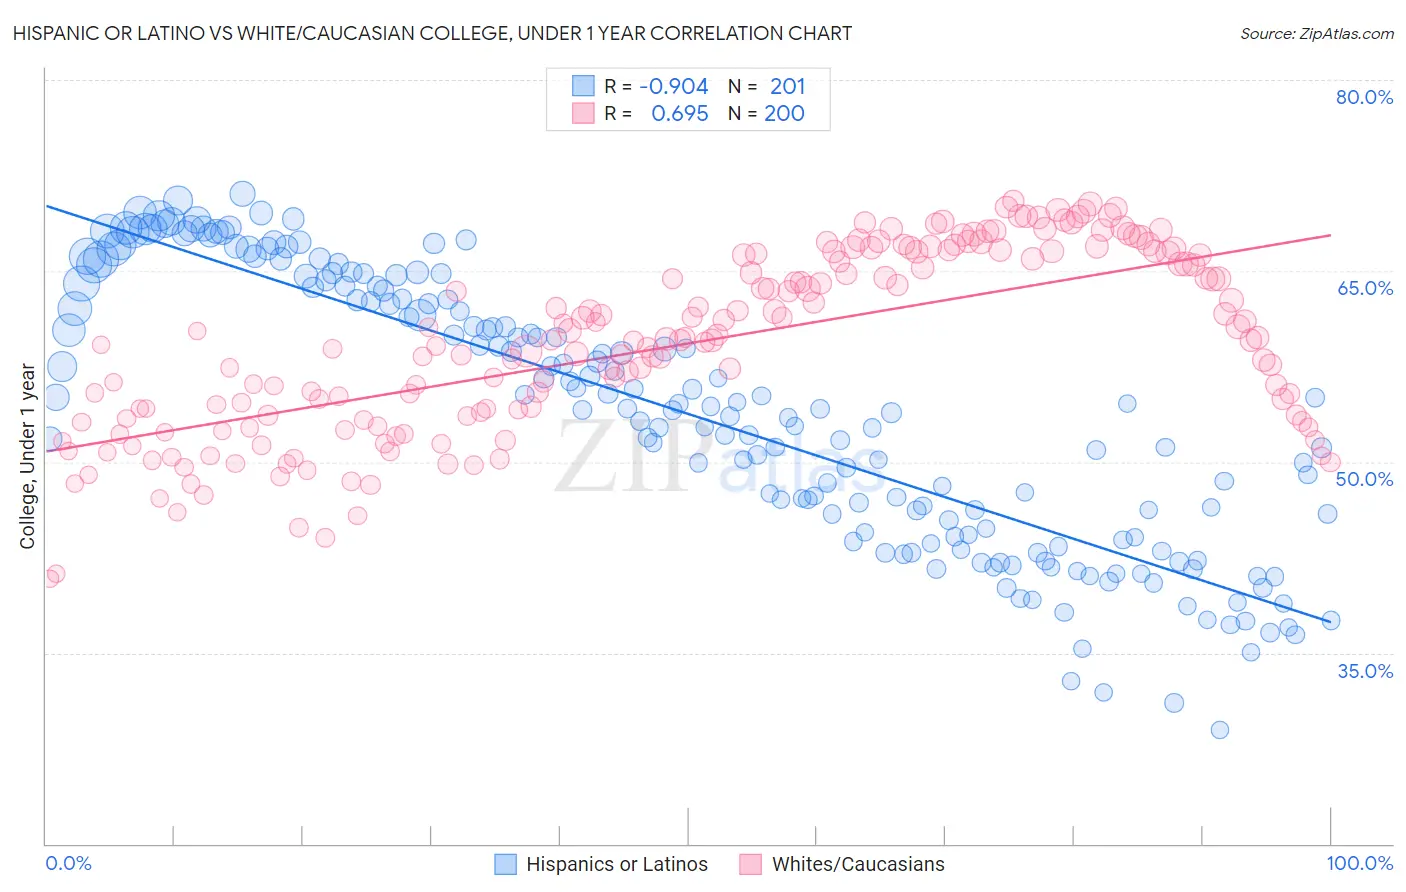
Hispanic or Latino vs White/Caucasian College, Under 1 year Correlation Chart
The statistical analysis conducted on geographies consisting of 578,595,027 people shows a near-perfect negative correlation between the proportion of Hispanics or Latinos and percentage of population with at least college, under 1 year education in the United States with a correlation coefficient (R) of -0.904 and weighted average of 57.0%. Similarly, the statistical analysis conducted on geographies consisting of 585,196,382 people shows a significant positive correlation between the proportion of Whites/Caucasians and percentage of population with at least college, under 1 year education in the United States with a correlation coefficient (R) of 0.695 and weighted average of 64.0%, a difference of 12.3%.
College, Under 1 year Correlation Summary
| Measurement | Hispanic or Latino | White/Caucasian |
| Minimum | 29.0% | 40.8% |
| Maximum | 71.0% | 70.5% |
| Range | 42.1% | 29.7% |
| Mean | 53.7% | 59.3% |
| Median | 54.2% | 59.6% |
| Interquartile 25% (IQ1) | 44.1% | 53.5% |
| Interquartile 75% (IQ3) | 63.6% | 66.3% |
| Interquartile Range (IQR) | 19.5% | 12.8% |
| Standard Deviation (Sample) | 10.5% | 7.1% |
| Standard Deviation (Population) | 10.5% | 7.1% |
Similar Demographics by College, Under 1 year
Demographics Similar to Hispanics or Latinos by College, Under 1 year
In terms of college, under 1 year, the demographic groups most similar to Hispanics or Latinos are Menominee (57.0%, a difference of 0.040%), Honduran (57.1%, a difference of 0.090%), Immigrants from Haiti (56.9%, a difference of 0.12%), Hopi (57.1%, a difference of 0.14%), and Dutch West Indian (57.2%, a difference of 0.26%).
| Demographics | Rating | Rank | College, Under 1 year |
| Pueblo | 0.0 /100 | #310 | Tragic 57.4% |
| Cajuns | 0.0 /100 | #311 | Tragic 57.3% |
| Salvadorans | 0.0 /100 | #312 | Tragic 57.3% |
| Dutch West Indians | 0.0 /100 | #313 | Tragic 57.2% |
| Hopi | 0.0 /100 | #314 | Tragic 57.1% |
| Hondurans | 0.0 /100 | #315 | Tragic 57.1% |
| Menominee | 0.0 /100 | #316 | Tragic 57.0% |
| Hispanics or Latinos | 0.0 /100 | #317 | Tragic 57.0% |
| Immigrants | Haiti | 0.0 /100 | #318 | Tragic 56.9% |
| Puerto Ricans | 0.0 /100 | #319 | Tragic 56.8% |
| Guatemalans | 0.0 /100 | #320 | Tragic 56.8% |
| Natives/Alaskans | 0.0 /100 | #321 | Tragic 56.6% |
| Immigrants | Caribbean | 0.0 /100 | #322 | Tragic 56.6% |
| Immigrants | Honduras | 0.0 /100 | #323 | Tragic 56.5% |
| Immigrants | El Salvador | 0.0 /100 | #324 | Tragic 56.4% |
Demographics Similar to Whites/Caucasians by College, Under 1 year
In terms of college, under 1 year, the demographic groups most similar to Whites/Caucasians are Colombian (64.0%, a difference of 0.040%), Immigrants from Vietnam (64.0%, a difference of 0.070%), Peruvian (64.1%, a difference of 0.090%), Puget Sound Salish (63.9%, a difference of 0.16%), and Immigrants from Zaire (64.1%, a difference of 0.17%).
| Demographics | Rating | Rank | College, Under 1 year |
| Panamanians | 17.0 /100 | #199 | Poor 64.3% |
| Nigerians | 16.7 /100 | #200 | Poor 64.3% |
| French Canadians | 16.3 /100 | #201 | Poor 64.2% |
| South Americans | 16.2 /100 | #202 | Poor 64.2% |
| Uruguayans | 15.6 /100 | #203 | Poor 64.2% |
| Immigrants | Zaire | 14.6 /100 | #204 | Poor 64.1% |
| Peruvians | 13.7 /100 | #205 | Poor 64.1% |
| Whites/Caucasians | 12.8 /100 | #206 | Poor 64.0% |
| Colombians | 12.4 /100 | #207 | Poor 64.0% |
| Immigrants | Vietnam | 12.1 /100 | #208 | Poor 64.0% |
| Puget Sound Salish | 11.3 /100 | #209 | Poor 63.9% |
| Ghanaians | 11.2 /100 | #210 | Poor 63.9% |
| Native Hawaiians | 10.6 /100 | #211 | Poor 63.9% |
| Immigrants | Middle Africa | 10.5 /100 | #212 | Poor 63.9% |
| Immigrants | South America | 9.1 /100 | #213 | Tragic 63.8% |