Somali vs Immigrants from Romania College, Under 1 year
COMPARE
Somali
Immigrants from Romania
College, Under 1 year
College, Under 1 year Comparison
Somalis
Immigrants from Romania
65.8%
COLLEGE, UNDER 1 YEAR
62.7/ 100
METRIC RATING
163rd/ 347
METRIC RANK
68.9%
COLLEGE, UNDER 1 YEAR
99.2/ 100
METRIC RATING
69th/ 347
METRIC RANK
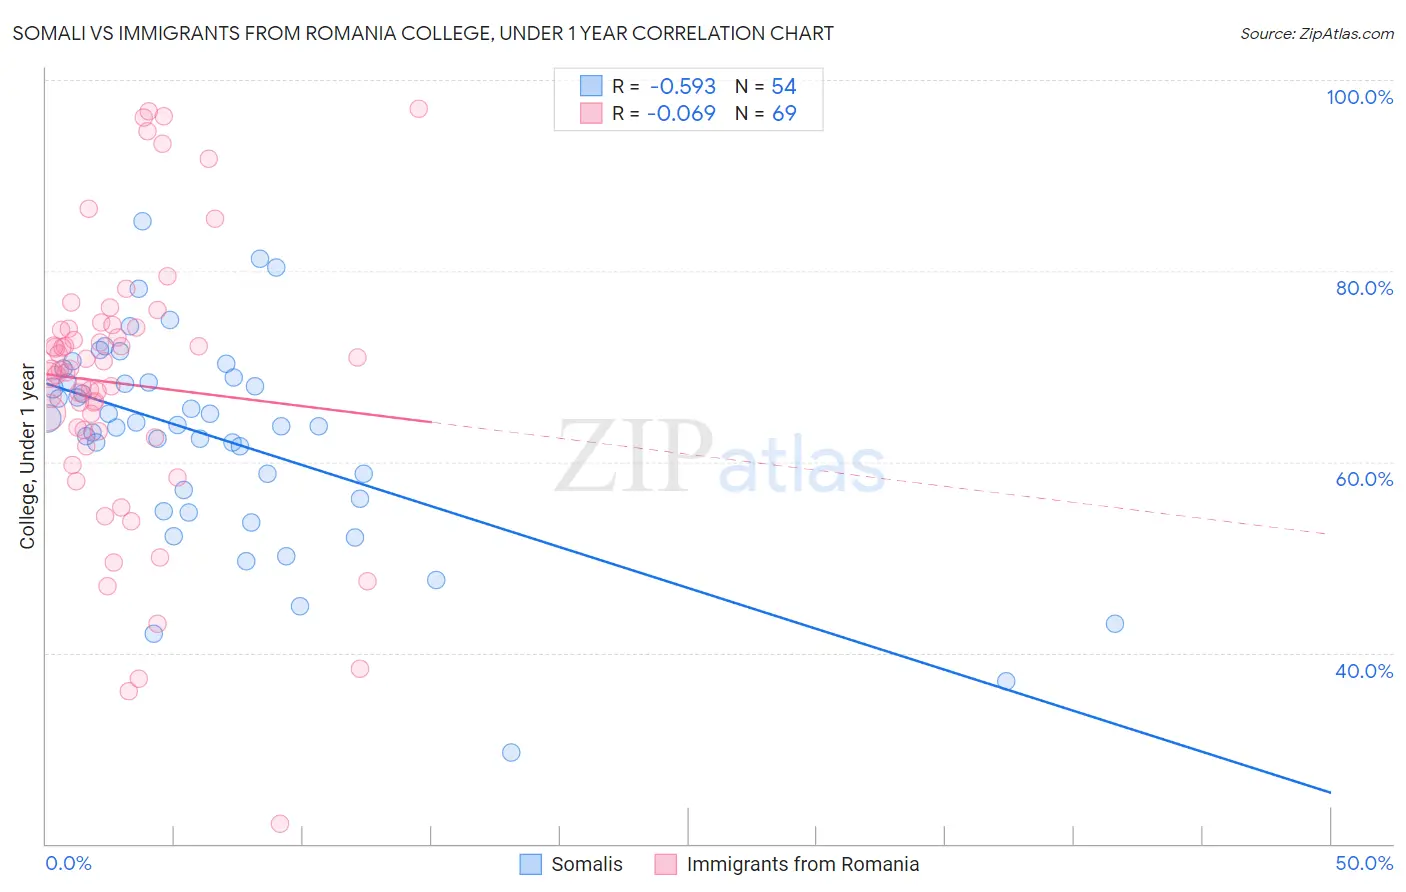
Somali vs Immigrants from Romania College, Under 1 year Correlation Chart
The statistical analysis conducted on geographies consisting of 99,332,457 people shows a substantial negative correlation between the proportion of Somalis and percentage of population with at least college, under 1 year education in the United States with a correlation coefficient (R) of -0.593 and weighted average of 65.8%. Similarly, the statistical analysis conducted on geographies consisting of 257,013,839 people shows a slight negative correlation between the proportion of Immigrants from Romania and percentage of population with at least college, under 1 year education in the United States with a correlation coefficient (R) of -0.069 and weighted average of 68.9%, a difference of 4.7%.
College, Under 1 year Correlation Summary
| Measurement | Somali | Immigrants from Romania |
| Minimum | 29.5% | 22.2% |
| Maximum | 85.2% | 97.0% |
| Range | 55.6% | 74.9% |
| Mean | 62.4% | 68.2% |
| Median | 63.8% | 69.6% |
| Interquartile 25% (IQ1) | 56.1% | 62.9% |
| Interquartile 75% (IQ3) | 68.3% | 74.0% |
| Interquartile Range (IQR) | 12.2% | 11.2% |
| Standard Deviation (Sample) | 10.9% | 14.7% |
| Standard Deviation (Population) | 10.8% | 14.6% |
Similar Demographics by College, Under 1 year
Demographics Similar to Somalis by College, Under 1 year
In terms of college, under 1 year, the demographic groups most similar to Somalis are Czechoslovakian (65.8%, a difference of 0.010%), Immigrants from Uzbekistan (65.8%, a difference of 0.050%), Korean (65.9%, a difference of 0.12%), Albanian (65.9%, a difference of 0.16%), and Brazilian (65.9%, a difference of 0.16%).
| Demographics | Rating | Rank | College, Under 1 year |
| Welsh | 69.9 /100 | #156 | Good 66.0% |
| Sierra Leoneans | 67.8 /100 | #157 | Good 66.0% |
| Celtics | 67.3 /100 | #158 | Good 65.9% |
| Tlingit-Haida | 66.4 /100 | #159 | Good 65.9% |
| Albanians | 66.1 /100 | #160 | Good 65.9% |
| Brazilians | 66.0 /100 | #161 | Good 65.9% |
| Koreans | 65.3 /100 | #162 | Good 65.9% |
| Somalis | 62.7 /100 | #163 | Good 65.8% |
| Czechoslovakians | 62.6 /100 | #164 | Good 65.8% |
| Immigrants | Uzbekistan | 61.6 /100 | #165 | Good 65.8% |
| Moroccans | 56.7 /100 | #166 | Average 65.6% |
| Immigrants | Somalia | 56.4 /100 | #167 | Average 65.6% |
| Hungarians | 55.9 /100 | #168 | Average 65.6% |
| Yugoslavians | 55.7 /100 | #169 | Average 65.6% |
| Germans | 55.7 /100 | #170 | Average 65.6% |
Demographics Similar to Immigrants from Romania by College, Under 1 year
In terms of college, under 1 year, the demographic groups most similar to Immigrants from Romania are Immigrants from Indonesia (68.9%, a difference of 0.020%), Immigrants from Zimbabwe (68.9%, a difference of 0.050%), Lithuanian (68.8%, a difference of 0.16%), Immigrants from Europe (68.8%, a difference of 0.18%), and Immigrants from North America (69.0%, a difference of 0.19%).
| Demographics | Rating | Rank | College, Under 1 year |
| Immigrants | Belarus | 99.5 /100 | #62 | Exceptional 69.2% |
| Immigrants | Canada | 99.4 /100 | #63 | Exceptional 69.1% |
| Northern Europeans | 99.4 /100 | #64 | Exceptional 69.0% |
| Immigrants | Moldova | 99.3 /100 | #65 | Exceptional 69.0% |
| Immigrants | North America | 99.3 /100 | #66 | Exceptional 69.0% |
| Immigrants | Zimbabwe | 99.2 /100 | #67 | Exceptional 68.9% |
| Immigrants | Indonesia | 99.2 /100 | #68 | Exceptional 68.9% |
| Immigrants | Romania | 99.2 /100 | #69 | Exceptional 68.9% |
| Lithuanians | 99.1 /100 | #70 | Exceptional 68.8% |
| Immigrants | Europe | 99.1 /100 | #71 | Exceptional 68.8% |
| Bolivians | 99.0 /100 | #72 | Exceptional 68.7% |
| Immigrants | England | 99.0 /100 | #73 | Exceptional 68.7% |
| Swedes | 98.9 /100 | #74 | Exceptional 68.7% |
| Immigrants | Western Europe | 98.6 /100 | #75 | Exceptional 68.5% |
| Laotians | 98.6 /100 | #76 | Exceptional 68.5% |