African vs White/Caucasian College, Under 1 year
COMPARE
African
White/Caucasian
College, Under 1 year
College, Under 1 year Comparison
Africans
Whites/Caucasians
61.1%
COLLEGE, UNDER 1 YEAR
0.3/ 100
METRIC RATING
261st/ 347
METRIC RANK
64.0%
COLLEGE, UNDER 1 YEAR
12.8/ 100
METRIC RATING
206th/ 347
METRIC RANK
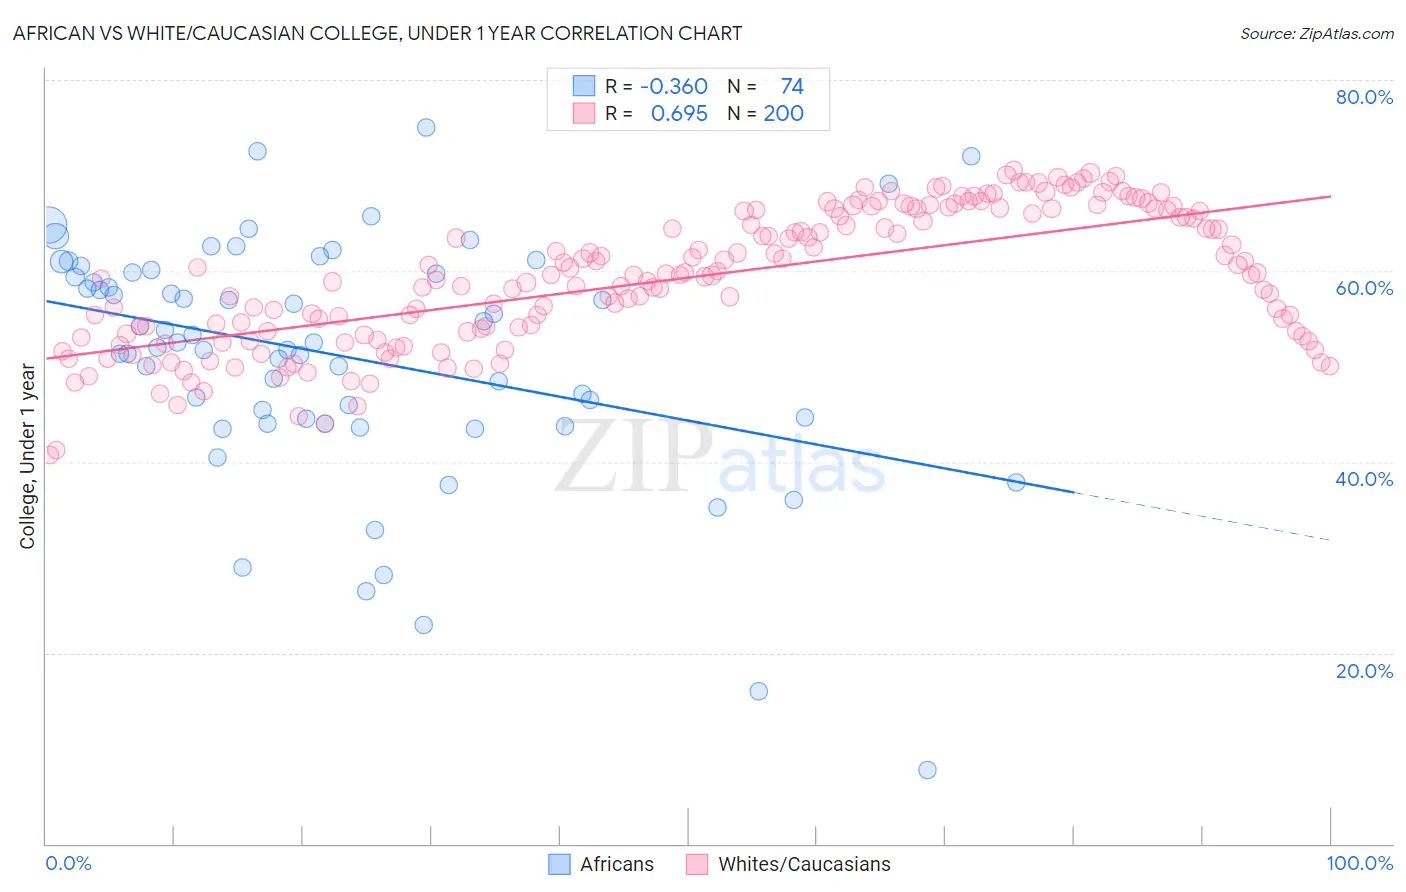
African vs White/Caucasian College, Under 1 year Correlation Chart
The statistical analysis conducted on geographies consisting of 470,092,177 people shows a mild negative correlation between the proportion of Africans and percentage of population with at least college, under 1 year education in the United States with a correlation coefficient (R) of -0.360 and weighted average of 61.1%. Similarly, the statistical analysis conducted on geographies consisting of 585,196,382 people shows a significant positive correlation between the proportion of Whites/Caucasians and percentage of population with at least college, under 1 year education in the United States with a correlation coefficient (R) of 0.695 and weighted average of 64.0%, a difference of 4.8%.
College, Under 1 year Correlation Summary
| Measurement | African | White/Caucasian |
| Minimum | 7.7% | 40.8% |
| Maximum | 75.0% | 70.5% |
| Range | 67.3% | 29.7% |
| Mean | 51.2% | 59.3% |
| Median | 52.5% | 59.6% |
| Interquartile 25% (IQ1) | 44.5% | 53.5% |
| Interquartile 75% (IQ3) | 59.9% | 66.3% |
| Interquartile Range (IQR) | 15.4% | 12.8% |
| Standard Deviation (Sample) | 12.7% | 7.1% |
| Standard Deviation (Population) | 12.6% | 7.1% |
Similar Demographics by College, Under 1 year
Demographics Similar to Africans by College, Under 1 year
In terms of college, under 1 year, the demographic groups most similar to Africans are Blackfeet (61.1%, a difference of 0.030%), Barbadian (61.1%, a difference of 0.040%), Shoshone (61.1%, a difference of 0.050%), Trinidadian and Tobagonian (61.1%, a difference of 0.11%), and Immigrants from Bahamas (61.1%, a difference of 0.11%).
| Demographics | Rating | Rank | College, Under 1 year |
| Immigrants | Cambodia | 0.4 /100 | #254 | Tragic 61.5% |
| Comanche | 0.4 /100 | #255 | Tragic 61.4% |
| Bangladeshis | 0.4 /100 | #256 | Tragic 61.4% |
| Immigrants | Laos | 0.3 /100 | #257 | Tragic 61.3% |
| Immigrants | Bangladesh | 0.3 /100 | #258 | Tragic 61.3% |
| Indonesians | 0.3 /100 | #259 | Tragic 61.2% |
| Blackfeet | 0.3 /100 | #260 | Tragic 61.1% |
| Africans | 0.3 /100 | #261 | Tragic 61.1% |
| Barbadians | 0.2 /100 | #262 | Tragic 61.1% |
| Shoshone | 0.2 /100 | #263 | Tragic 61.1% |
| Trinidadians and Tobagonians | 0.2 /100 | #264 | Tragic 61.1% |
| Immigrants | Bahamas | 0.2 /100 | #265 | Tragic 61.1% |
| Alaskan Athabascans | 0.2 /100 | #266 | Tragic 61.0% |
| Americans | 0.2 /100 | #267 | Tragic 61.0% |
| Immigrants | Trinidad and Tobago | 0.1 /100 | #268 | Tragic 60.7% |
Demographics Similar to Whites/Caucasians by College, Under 1 year
In terms of college, under 1 year, the demographic groups most similar to Whites/Caucasians are Colombian (64.0%, a difference of 0.040%), Immigrants from Vietnam (64.0%, a difference of 0.070%), Peruvian (64.1%, a difference of 0.090%), Puget Sound Salish (63.9%, a difference of 0.16%), and Immigrants from Zaire (64.1%, a difference of 0.17%).
| Demographics | Rating | Rank | College, Under 1 year |
| Panamanians | 17.0 /100 | #199 | Poor 64.3% |
| Nigerians | 16.7 /100 | #200 | Poor 64.3% |
| French Canadians | 16.3 /100 | #201 | Poor 64.2% |
| South Americans | 16.2 /100 | #202 | Poor 64.2% |
| Uruguayans | 15.6 /100 | #203 | Poor 64.2% |
| Immigrants | Zaire | 14.6 /100 | #204 | Poor 64.1% |
| Peruvians | 13.7 /100 | #205 | Poor 64.1% |
| Whites/Caucasians | 12.8 /100 | #206 | Poor 64.0% |
| Colombians | 12.4 /100 | #207 | Poor 64.0% |
| Immigrants | Vietnam | 12.1 /100 | #208 | Poor 64.0% |
| Puget Sound Salish | 11.3 /100 | #209 | Poor 63.9% |
| Ghanaians | 11.2 /100 | #210 | Poor 63.9% |
| Native Hawaiians | 10.6 /100 | #211 | Poor 63.9% |
| Immigrants | Middle Africa | 10.5 /100 | #212 | Poor 63.9% |
| Immigrants | South America | 9.1 /100 | #213 | Tragic 63.8% |