Immigrants from Italy vs White/Caucasian College, Under 1 year
COMPARE
Immigrants from Italy
White/Caucasian
College, Under 1 year
College, Under 1 year Comparison
Immigrants from Italy
Whites/Caucasians
66.8%
COLLEGE, UNDER 1 YEAR
86.9/ 100
METRIC RATING
138th/ 347
METRIC RANK
64.0%
COLLEGE, UNDER 1 YEAR
12.8/ 100
METRIC RATING
206th/ 347
METRIC RANK
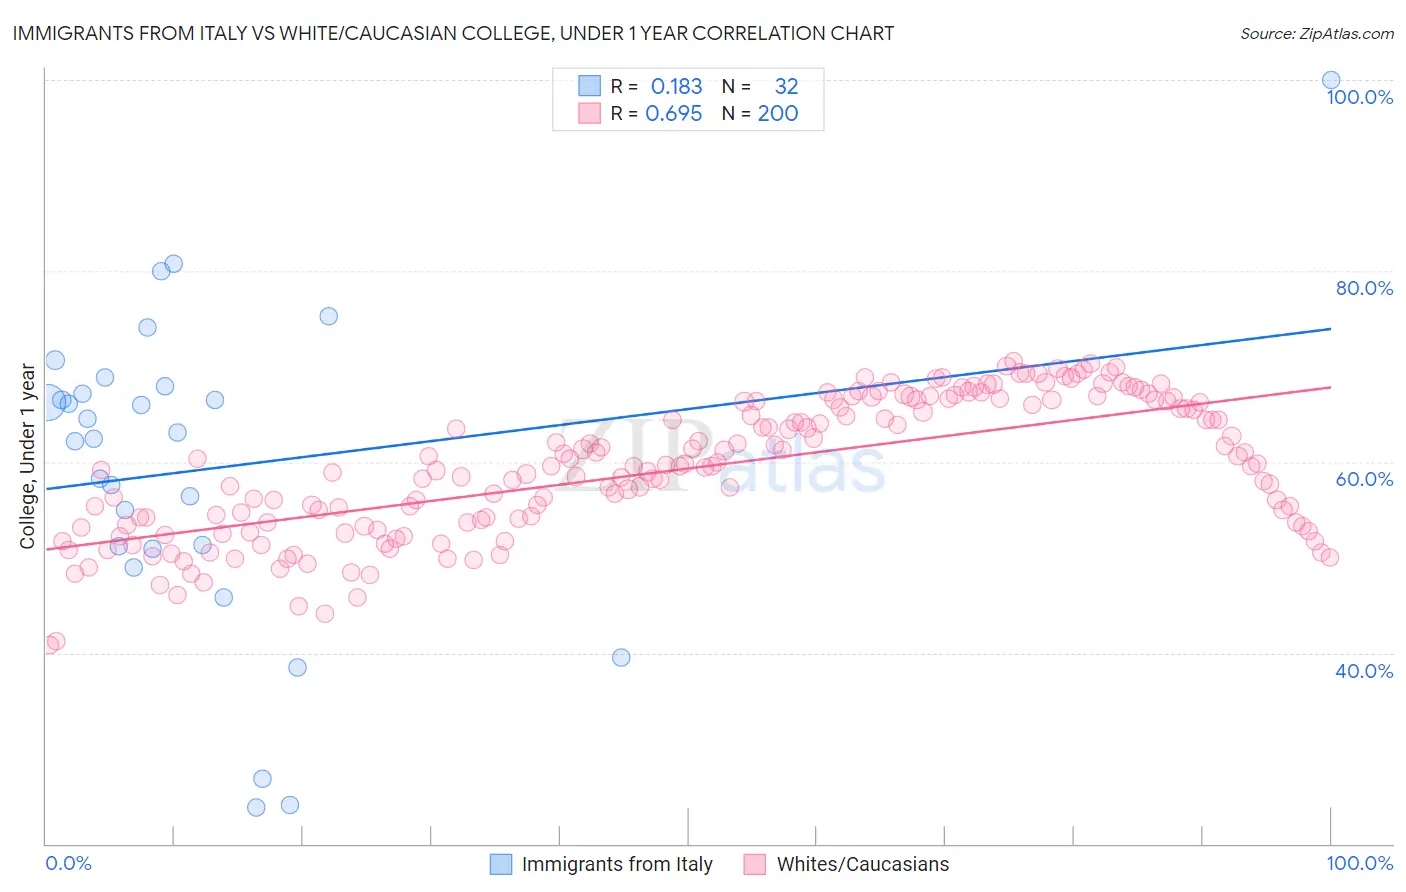
Immigrants from Italy vs White/Caucasian College, Under 1 year Correlation Chart
The statistical analysis conducted on geographies consisting of 324,223,988 people shows a poor positive correlation between the proportion of Immigrants from Italy and percentage of population with at least college, under 1 year education in the United States with a correlation coefficient (R) of 0.183 and weighted average of 66.8%. Similarly, the statistical analysis conducted on geographies consisting of 585,196,382 people shows a significant positive correlation between the proportion of Whites/Caucasians and percentage of population with at least college, under 1 year education in the United States with a correlation coefficient (R) of 0.695 and weighted average of 64.0%, a difference of 4.3%.
College, Under 1 year Correlation Summary
| Measurement | Immigrants from Italy | White/Caucasian |
| Minimum | 23.8% | 40.8% |
| Maximum | 100.0% | 70.5% |
| Range | 76.2% | 29.7% |
| Mean | 59.2% | 59.3% |
| Median | 62.7% | 59.6% |
| Interquartile 25% (IQ1) | 51.0% | 53.5% |
| Interquartile 75% (IQ3) | 67.5% | 66.3% |
| Interquartile Range (IQR) | 16.5% | 12.8% |
| Standard Deviation (Sample) | 16.6% | 7.1% |
| Standard Deviation (Population) | 16.4% | 7.1% |
Similar Demographics by College, Under 1 year
Demographics Similar to Immigrants from Italy by College, Under 1 year
In terms of college, under 1 year, the demographic groups most similar to Immigrants from Italy are Immigrants from Chile (66.8%, a difference of 0.050%), Ugandan (66.8%, a difference of 0.080%), Canadian (66.8%, a difference of 0.090%), Iraqi (66.8%, a difference of 0.10%), and Venezuelan (66.7%, a difference of 0.10%).
| Demographics | Rating | Rank | College, Under 1 year |
| Finns | 88.6 /100 | #131 | Excellent 66.9% |
| Poles | 88.4 /100 | #132 | Excellent 66.9% |
| Immigrants | Brazil | 88.3 /100 | #133 | Excellent 66.9% |
| Iraqis | 88.0 /100 | #134 | Excellent 66.8% |
| Canadians | 87.9 /100 | #135 | Excellent 66.8% |
| Ugandans | 87.8 /100 | #136 | Excellent 66.8% |
| Immigrants | Chile | 87.4 /100 | #137 | Excellent 66.8% |
| Immigrants | Italy | 86.9 /100 | #138 | Excellent 66.8% |
| Venezuelans | 85.9 /100 | #139 | Excellent 66.7% |
| Slavs | 85.9 /100 | #140 | Excellent 66.7% |
| Immigrants | Afghanistan | 85.1 /100 | #141 | Excellent 66.7% |
| English | 82.9 /100 | #142 | Excellent 66.6% |
| Immigrants | Uganda | 82.8 /100 | #143 | Excellent 66.5% |
| Immigrants | Germany | 82.0 /100 | #144 | Excellent 66.5% |
| Immigrants | Kenya | 81.8 /100 | #145 | Excellent 66.5% |
Demographics Similar to Whites/Caucasians by College, Under 1 year
In terms of college, under 1 year, the demographic groups most similar to Whites/Caucasians are Colombian (64.0%, a difference of 0.040%), Immigrants from Vietnam (64.0%, a difference of 0.070%), Peruvian (64.1%, a difference of 0.090%), Puget Sound Salish (63.9%, a difference of 0.16%), and Immigrants from Zaire (64.1%, a difference of 0.17%).
| Demographics | Rating | Rank | College, Under 1 year |
| Panamanians | 17.0 /100 | #199 | Poor 64.3% |
| Nigerians | 16.7 /100 | #200 | Poor 64.3% |
| French Canadians | 16.3 /100 | #201 | Poor 64.2% |
| South Americans | 16.2 /100 | #202 | Poor 64.2% |
| Uruguayans | 15.6 /100 | #203 | Poor 64.2% |
| Immigrants | Zaire | 14.6 /100 | #204 | Poor 64.1% |
| Peruvians | 13.7 /100 | #205 | Poor 64.1% |
| Whites/Caucasians | 12.8 /100 | #206 | Poor 64.0% |
| Colombians | 12.4 /100 | #207 | Poor 64.0% |
| Immigrants | Vietnam | 12.1 /100 | #208 | Poor 64.0% |
| Puget Sound Salish | 11.3 /100 | #209 | Poor 63.9% |
| Ghanaians | 11.2 /100 | #210 | Poor 63.9% |
| Native Hawaiians | 10.6 /100 | #211 | Poor 63.9% |
| Immigrants | Middle Africa | 10.5 /100 | #212 | Poor 63.9% |
| Immigrants | South America | 9.1 /100 | #213 | Tragic 63.8% |