Immigrants from Senegal vs Sierra Leonean No Schooling Completed
COMPARE
Immigrants from Senegal
Sierra Leonean
No Schooling Completed
No Schooling Completed Comparison
Immigrants from Senegal
Sierra Leoneans
2.4%
NO SCHOOLING COMPLETED
1.7/ 100
METRIC RATING
240th/ 347
METRIC RANK
2.3%
NO SCHOOLING COMPLETED
4.1/ 100
METRIC RATING
226th/ 347
METRIC RANK
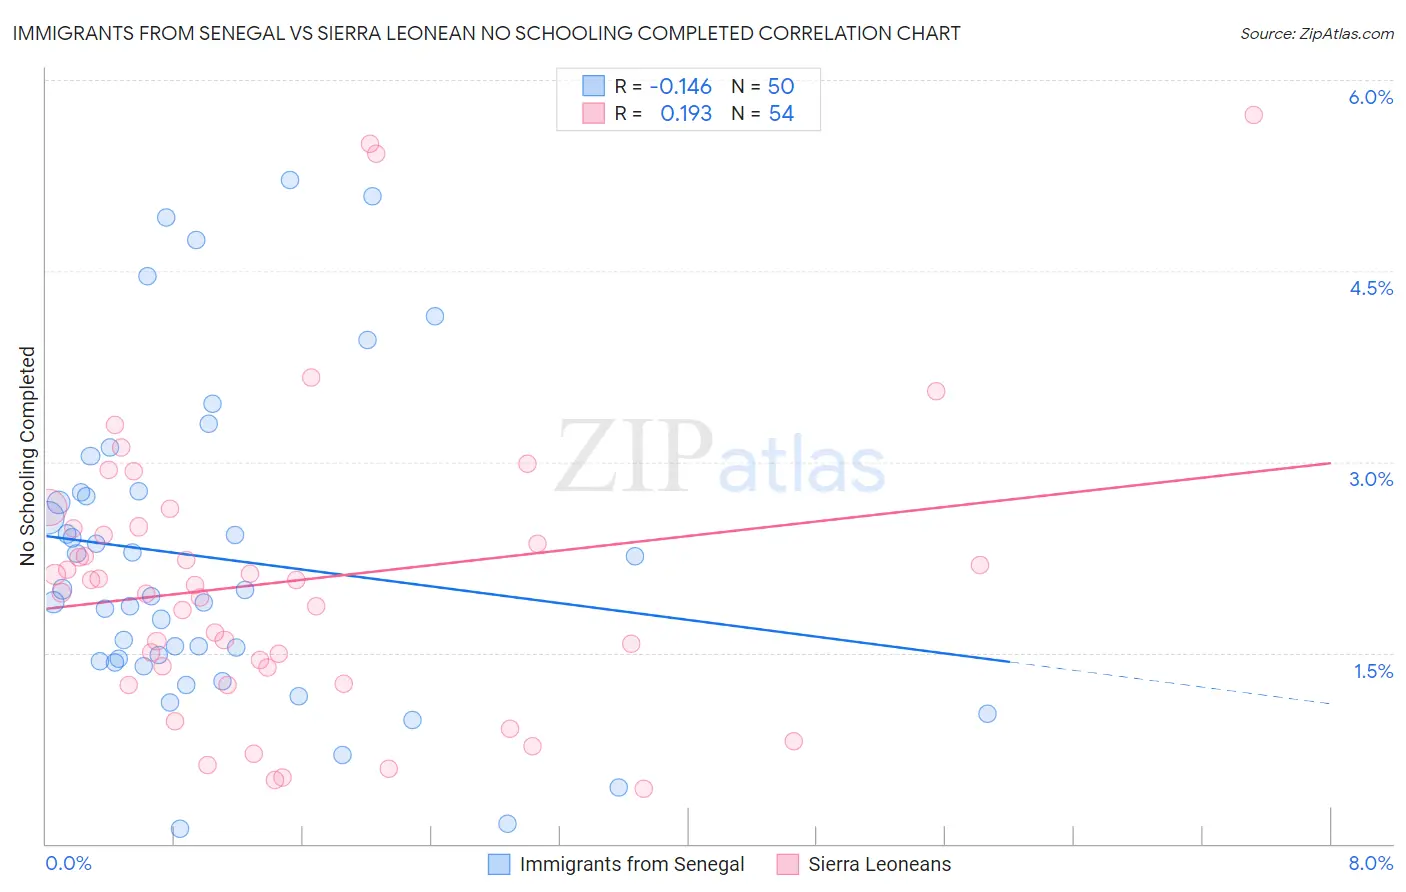
Immigrants from Senegal vs Sierra Leonean No Schooling Completed Correlation Chart
The statistical analysis conducted on geographies consisting of 90,026,506 people shows a poor negative correlation between the proportion of Immigrants from Senegal and percentage of population with no schooling in the United States with a correlation coefficient (R) of -0.146 and weighted average of 2.4%. Similarly, the statistical analysis conducted on geographies consisting of 83,108,801 people shows a poor positive correlation between the proportion of Sierra Leoneans and percentage of population with no schooling in the United States with a correlation coefficient (R) of 0.193 and weighted average of 2.3%, a difference of 2.8%.
No Schooling Completed Correlation Summary
| Measurement | Immigrants from Senegal | Sierra Leonean |
| Minimum | 0.12% | 0.44% |
| Maximum | 5.2% | 5.7% |
| Range | 5.1% | 5.3% |
| Mean | 2.2% | 2.1% |
| Median | 2.0% | 2.0% |
| Interquartile 25% (IQ1) | 1.4% | 1.4% |
| Interquartile 75% (IQ3) | 2.8% | 2.5% |
| Interquartile Range (IQR) | 1.3% | 1.1% |
| Standard Deviation (Sample) | 1.2% | 1.2% |
| Standard Deviation (Population) | 1.2% | 1.2% |
Demographics Similar to Immigrants from Senegal and Sierra Leoneans by No Schooling Completed
In terms of no schooling completed, the demographic groups most similar to Immigrants from Senegal are Korean (2.4%, a difference of 0.060%), Liberian (2.4%, a difference of 0.23%), Paiute (2.4%, a difference of 0.35%), Immigrants from Indonesia (2.4%, a difference of 0.38%), and South American (2.4%, a difference of 0.42%). Similarly, the demographic groups most similar to Sierra Leoneans are Sudanese (2.3%, a difference of 0.010%), Tohono O'odham (2.3%, a difference of 0.020%), Immigrants from Uganda (2.3%, a difference of 0.060%), Immigrants from Lebanon (2.3%, a difference of 0.30%), and U.S. Virgin Islander (2.3%, a difference of 0.34%).
| Demographics | Rating | Rank | No Schooling Completed |
| Immigrants | Lebanon | 4.5 /100 | #223 | Tragic 2.3% |
| Tohono O'odham | 4.1 /100 | #224 | Tragic 2.3% |
| Sudanese | 4.1 /100 | #225 | Tragic 2.3% |
| Sierra Leoneans | 4.1 /100 | #226 | Tragic 2.3% |
| Immigrants | Uganda | 4.0 /100 | #227 | Tragic 2.3% |
| U.S. Virgin Islanders | 3.7 /100 | #228 | Tragic 2.3% |
| Immigrants | Pakistan | 3.6 /100 | #229 | Tragic 2.3% |
| Puerto Ricans | 3.4 /100 | #230 | Tragic 2.3% |
| Immigrants | Uruguay | 3.4 /100 | #231 | Tragic 2.3% |
| Colombians | 3.2 /100 | #232 | Tragic 2.3% |
| Immigrants | Malaysia | 2.8 /100 | #233 | Tragic 2.3% |
| Nigerians | 2.6 /100 | #234 | Tragic 2.3% |
| Immigrants | Western Asia | 2.6 /100 | #235 | Tragic 2.3% |
| Iraqis | 2.2 /100 | #236 | Tragic 2.4% |
| Immigrants | Eastern Asia | 2.0 /100 | #237 | Tragic 2.4% |
| Paiute | 1.9 /100 | #238 | Tragic 2.4% |
| Liberians | 1.8 /100 | #239 | Tragic 2.4% |
| Immigrants | Senegal | 1.7 /100 | #240 | Tragic 2.4% |
| Koreans | 1.7 /100 | #241 | Tragic 2.4% |
| Immigrants | Indonesia | 1.5 /100 | #242 | Tragic 2.4% |
| South Americans | 1.5 /100 | #243 | Tragic 2.4% |