Somali vs Sierra Leonean In Labor Force | Age 45-54
COMPARE
Somali
Sierra Leonean
In Labor Force | Age 45-54
In Labor Force | Age 45-54 Comparison
Somalis
Sierra Leoneans
83.5%
IN LABOR FORCE | AGE 45-54
98.7/ 100
METRIC RATING
54th/ 347
METRIC RANK
84.5%
IN LABOR FORCE | AGE 45-54
100.0/ 100
METRIC RATING
8th/ 347
METRIC RANK
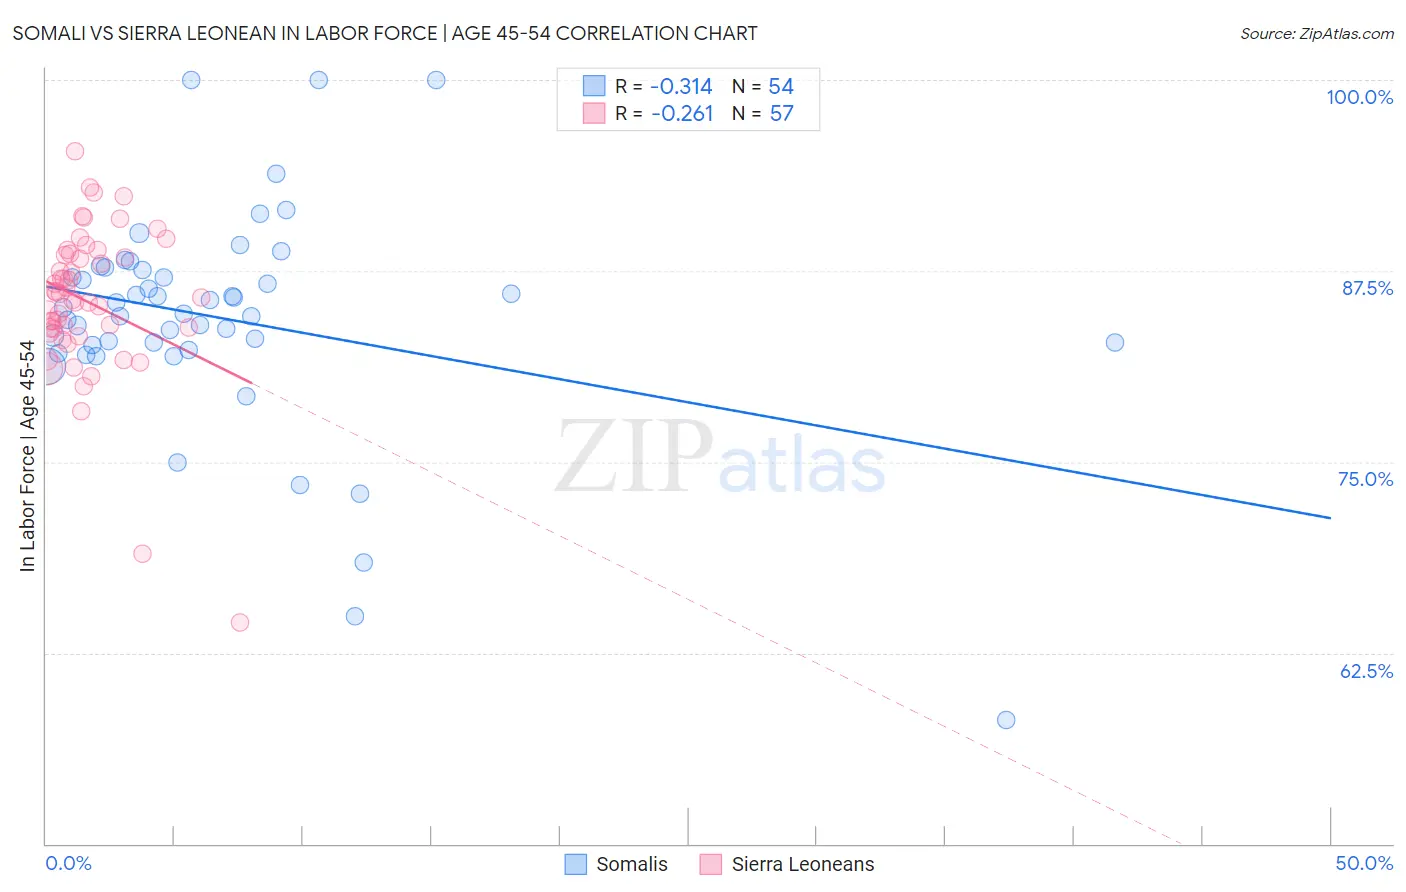
Somali vs Sierra Leonean In Labor Force | Age 45-54 Correlation Chart
The statistical analysis conducted on geographies consisting of 99,291,409 people shows a mild negative correlation between the proportion of Somalis and labor force participation rate among population between the ages 45 and 54 in the United States with a correlation coefficient (R) of -0.314 and weighted average of 83.5%. Similarly, the statistical analysis conducted on geographies consisting of 83,350,060 people shows a weak negative correlation between the proportion of Sierra Leoneans and labor force participation rate among population between the ages 45 and 54 in the United States with a correlation coefficient (R) of -0.261 and weighted average of 84.5%, a difference of 1.1%.
In Labor Force | Age 45-54 Correlation Summary
| Measurement | Somali | Sierra Leonean |
| Minimum | 58.1% | 64.5% |
| Maximum | 100.0% | 95.3% |
| Range | 41.9% | 30.8% |
| Mean | 84.4% | 85.5% |
| Median | 84.9% | 85.8% |
| Interquartile 25% (IQ1) | 82.7% | 83.6% |
| Interquartile 75% (IQ3) | 87.6% | 88.6% |
| Interquartile Range (IQR) | 4.9% | 5.0% |
| Standard Deviation (Sample) | 7.3% | 5.1% |
| Standard Deviation (Population) | 7.3% | 5.0% |
Similar Demographics by In Labor Force | Age 45-54
Demographics Similar to Somalis by In Labor Force | Age 45-54
In terms of in labor force | age 45-54, the demographic groups most similar to Somalis are Immigrants from Turkey (83.6%, a difference of 0.010%), Polish (83.6%, a difference of 0.010%), Peruvian (83.6%, a difference of 0.010%), Macedonian (83.5%, a difference of 0.010%), and Immigrants from Greece (83.6%, a difference of 0.020%).
| Demographics | Rating | Rank | In Labor Force | Age 45-54 |
| Croatians | 99.0 /100 | #47 | Exceptional 83.6% |
| Immigrants | Poland | 99.0 /100 | #48 | Exceptional 83.6% |
| Immigrants | Morocco | 99.0 /100 | #49 | Exceptional 83.6% |
| Immigrants | Greece | 98.8 /100 | #50 | Exceptional 83.6% |
| Immigrants | Turkey | 98.8 /100 | #51 | Exceptional 83.6% |
| Poles | 98.7 /100 | #52 | Exceptional 83.6% |
| Peruvians | 98.7 /100 | #53 | Exceptional 83.6% |
| Somalis | 98.7 /100 | #54 | Exceptional 83.5% |
| Macedonians | 98.7 /100 | #55 | Exceptional 83.5% |
| Immigrants | Peru | 98.6 /100 | #56 | Exceptional 83.5% |
| Paraguayans | 98.5 /100 | #57 | Exceptional 83.5% |
| Eastern Europeans | 98.5 /100 | #58 | Exceptional 83.5% |
| Bhutanese | 98.3 /100 | #59 | Exceptional 83.5% |
| Carpatho Rusyns | 98.3 /100 | #60 | Exceptional 83.5% |
| Filipinos | 98.3 /100 | #61 | Exceptional 83.5% |
Demographics Similar to Sierra Leoneans by In Labor Force | Age 45-54
In terms of in labor force | age 45-54, the demographic groups most similar to Sierra Leoneans are Immigrants from Cameroon (84.6%, a difference of 0.11%), Immigrants from Sierra Leone (84.4%, a difference of 0.11%), Norwegian (84.4%, a difference of 0.13%), Immigrants from India (84.7%, a difference of 0.18%), and Thai (84.3%, a difference of 0.22%).
| Demographics | Rating | Rank | In Labor Force | Age 45-54 |
| Immigrants | Bolivia | 100.0 /100 | #1 | Exceptional 85.3% |
| Luxembourgers | 100.0 /100 | #2 | Exceptional 85.0% |
| Bolivians | 100.0 /100 | #3 | Exceptional 84.9% |
| Immigrants | Ethiopia | 100.0 /100 | #4 | Exceptional 84.8% |
| Ethiopians | 100.0 /100 | #5 | Exceptional 84.8% |
| Immigrants | India | 100.0 /100 | #6 | Exceptional 84.7% |
| Immigrants | Cameroon | 100.0 /100 | #7 | Exceptional 84.6% |
| Sierra Leoneans | 100.0 /100 | #8 | Exceptional 84.5% |
| Immigrants | Sierra Leone | 100.0 /100 | #9 | Exceptional 84.4% |
| Norwegians | 100.0 /100 | #10 | Exceptional 84.4% |
| Thais | 100.0 /100 | #11 | Exceptional 84.3% |
| Bulgarians | 100.0 /100 | #12 | Exceptional 84.2% |
| Chinese | 99.9 /100 | #13 | Exceptional 84.1% |
| Cambodians | 99.9 /100 | #14 | Exceptional 84.1% |
| Cypriots | 99.9 /100 | #15 | Exceptional 84.1% |