Guyanese vs Alaska Native Doctorate Degree
COMPARE
Guyanese
Alaska Native
Doctorate Degree
Doctorate Degree Comparison
Guyanese
Alaska Natives
1.4%
DOCTORATE DEGREE
0.1/ 100
METRIC RATING
306th/ 347
METRIC RANK
1.4%
DOCTORATE DEGREE
0.3/ 100
METRIC RATING
292nd/ 347
METRIC RANK
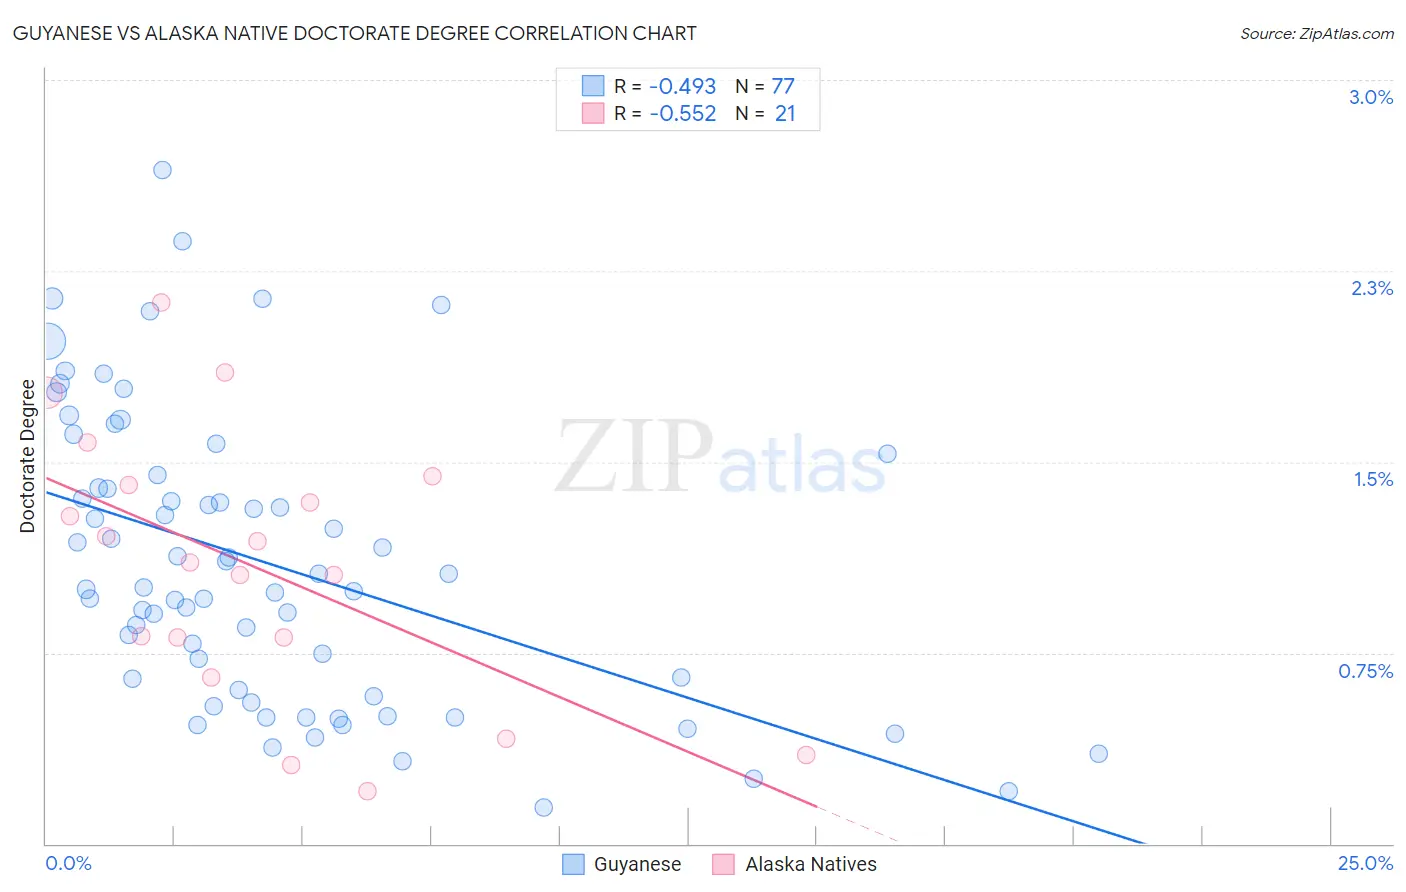
Guyanese vs Alaska Native Doctorate Degree Correlation Chart
The statistical analysis conducted on geographies consisting of 176,288,102 people shows a moderate negative correlation between the proportion of Guyanese and percentage of population with at least doctorate degree education in the United States with a correlation coefficient (R) of -0.493 and weighted average of 1.4%. Similarly, the statistical analysis conducted on geographies consisting of 76,370,977 people shows a substantial negative correlation between the proportion of Alaska Natives and percentage of population with at least doctorate degree education in the United States with a correlation coefficient (R) of -0.552 and weighted average of 1.4%, a difference of 4.3%.
Doctorate Degree Correlation Summary
| Measurement | Guyanese | Alaska Native |
| Minimum | 0.14% | 0.21% |
| Maximum | 2.6% | 2.1% |
| Range | 2.5% | 1.9% |
| Mean | 1.1% | 1.1% |
| Median | 1.0% | 1.1% |
| Interquartile 25% (IQ1) | 0.59% | 0.73% |
| Interquartile 75% (IQ3) | 1.4% | 1.4% |
| Interquartile Range (IQR) | 0.83% | 0.69% |
| Standard Deviation (Sample) | 0.57% | 0.53% |
| Standard Deviation (Population) | 0.56% | 0.51% |
Demographics Similar to Guyanese and Alaska Natives by Doctorate Degree
In terms of doctorate degree, the demographic groups most similar to Guyanese are Pennsylvania German (1.4%, a difference of 0.010%), Mexican American Indian (1.4%, a difference of 0.15%), Immigrants from Dominica (1.4%, a difference of 0.20%), Shoshone (1.4%, a difference of 0.23%), and Cuban (1.4%, a difference of 0.25%). Similarly, the demographic groups most similar to Alaska Natives are Black/African American (1.4%, a difference of 0.17%), Choctaw (1.4%, a difference of 0.40%), Cape Verdean (1.4%, a difference of 0.42%), Immigrants from Yemen (1.4%, a difference of 0.59%), and Samoan (1.4%, a difference of 1.3%).
| Demographics | Rating | Rank | Doctorate Degree |
| Cape Verdeans | 0.3 /100 | #289 | Tragic 1.4% |
| Choctaw | 0.3 /100 | #290 | Tragic 1.4% |
| Blacks/African Americans | 0.3 /100 | #291 | Tragic 1.4% |
| Alaska Natives | 0.3 /100 | #292 | Tragic 1.4% |
| Immigrants | Yemen | 0.2 /100 | #293 | Tragic 1.4% |
| Samoans | 0.2 /100 | #294 | Tragic 1.4% |
| Guatemalans | 0.2 /100 | #295 | Tragic 1.4% |
| Immigrants | Ecuador | 0.2 /100 | #296 | Tragic 1.4% |
| Tsimshian | 0.2 /100 | #297 | Tragic 1.4% |
| Puerto Ricans | 0.1 /100 | #298 | Tragic 1.4% |
| Belizeans | 0.1 /100 | #299 | Tragic 1.4% |
| Immigrants | Guatemala | 0.1 /100 | #300 | Tragic 1.4% |
| Hondurans | 0.1 /100 | #301 | Tragic 1.4% |
| Shoshone | 0.1 /100 | #302 | Tragic 1.4% |
| Immigrants | Dominica | 0.1 /100 | #303 | Tragic 1.4% |
| Mexican American Indians | 0.1 /100 | #304 | Tragic 1.4% |
| Pennsylvania Germans | 0.1 /100 | #305 | Tragic 1.4% |
| Guyanese | 0.1 /100 | #306 | Tragic 1.4% |
| Cubans | 0.1 /100 | #307 | Tragic 1.4% |
| Immigrants | Laos | 0.1 /100 | #308 | Tragic 1.4% |
| Immigrants | Grenada | 0.1 /100 | #309 | Tragic 1.4% |