Somali vs Menominee Doctorate Degree
COMPARE
Somali
Menominee
Doctorate Degree
Doctorate Degree Comparison
Somalis
Menominee
1.7%
DOCTORATE DEGREE
21.2/ 100
METRIC RATING
204th/ 347
METRIC RANK
1.4%
DOCTORATE DEGREE
0.1/ 100
METRIC RATING
313th/ 347
METRIC RANK
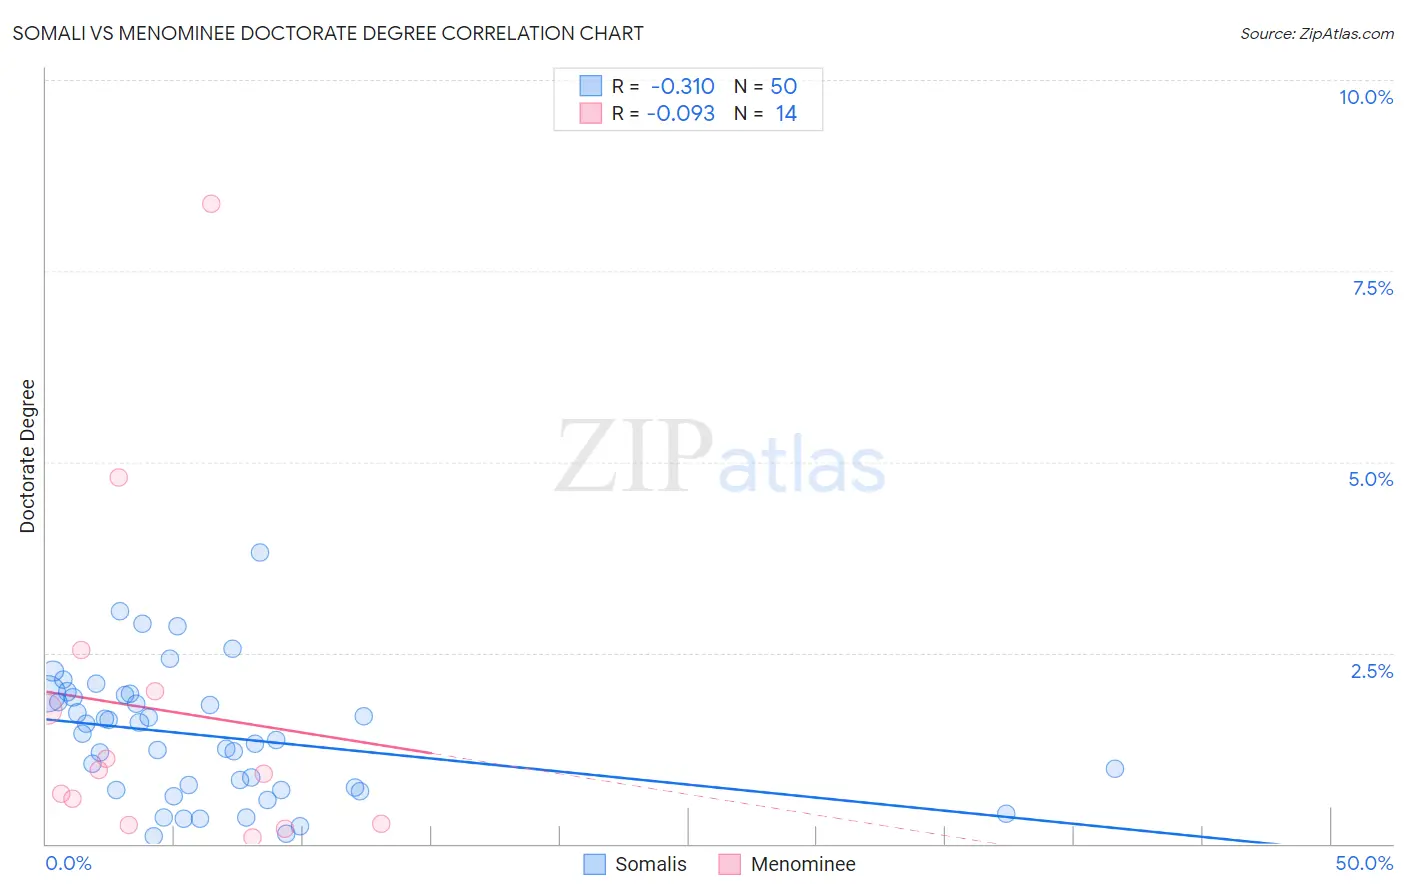
Somali vs Menominee Doctorate Degree Correlation Chart
The statistical analysis conducted on geographies consisting of 99,087,953 people shows a mild negative correlation between the proportion of Somalis and percentage of population with at least doctorate degree education in the United States with a correlation coefficient (R) of -0.310 and weighted average of 1.7%. Similarly, the statistical analysis conducted on geographies consisting of 45,550,616 people shows a slight negative correlation between the proportion of Menominee and percentage of population with at least doctorate degree education in the United States with a correlation coefficient (R) of -0.093 and weighted average of 1.4%, a difference of 29.2%.
Doctorate Degree Correlation Summary
| Measurement | Somali | Menominee |
| Minimum | 0.094% | 0.087% |
| Maximum | 3.8% | 8.4% |
| Range | 3.7% | 8.3% |
| Mean | 1.4% | 1.8% |
| Median | 1.4% | 0.94% |
| Interquartile 25% (IQ1) | 0.70% | 0.26% |
| Interquartile 75% (IQ3) | 1.9% | 2.0% |
| Interquartile Range (IQR) | 1.2% | 1.7% |
| Standard Deviation (Sample) | 0.84% | 2.3% |
| Standard Deviation (Population) | 0.83% | 2.2% |
Similar Demographics by Doctorate Degree
Demographics Similar to Somalis by Doctorate Degree
In terms of doctorate degree, the demographic groups most similar to Somalis are Immigrants from Vietnam (1.8%, a difference of 0.030%), Portuguese (1.8%, a difference of 0.050%), Immigrants from Nigeria (1.8%, a difference of 0.28%), White/Caucasian (1.8%, a difference of 0.35%), and Venezuelan (1.7%, a difference of 0.41%).
| Demographics | Rating | Rank | Doctorate Degree |
| Chinese | 25.1 /100 | #197 | Fair 1.8% |
| Immigrants | Ghana | 24.6 /100 | #198 | Fair 1.8% |
| Immigrants | South America | 23.3 /100 | #199 | Fair 1.8% |
| Whites/Caucasians | 22.8 /100 | #200 | Fair 1.8% |
| Immigrants | Nigeria | 22.4 /100 | #201 | Fair 1.8% |
| Portuguese | 21.4 /100 | #202 | Fair 1.8% |
| Immigrants | Vietnam | 21.4 /100 | #203 | Fair 1.8% |
| Somalis | 21.2 /100 | #204 | Fair 1.7% |
| Venezuelans | 19.5 /100 | #205 | Poor 1.7% |
| Immigrants | Peru | 17.6 /100 | #206 | Poor 1.7% |
| Yugoslavians | 17.1 /100 | #207 | Poor 1.7% |
| Colombians | 16.1 /100 | #208 | Poor 1.7% |
| Immigrants | Western Africa | 15.4 /100 | #209 | Poor 1.7% |
| Tongans | 15.1 /100 | #210 | Poor 1.7% |
| Immigrants | Armenia | 15.1 /100 | #211 | Poor 1.7% |
Demographics Similar to Menominee by Doctorate Degree
In terms of doctorate degree, the demographic groups most similar to Menominee are Dominican (1.4%, a difference of 0.080%), Immigrants from the Azores (1.4%, a difference of 0.10%), Navajo (1.4%, a difference of 0.31%), Immigrants from Nicaragua (1.4%, a difference of 0.32%), and Immigrants from Micronesia (1.3%, a difference of 0.55%).
| Demographics | Rating | Rank | Doctorate Degree |
| Guyanese | 0.1 /100 | #306 | Tragic 1.4% |
| Cubans | 0.1 /100 | #307 | Tragic 1.4% |
| Immigrants | Laos | 0.1 /100 | #308 | Tragic 1.4% |
| Immigrants | Grenada | 0.1 /100 | #309 | Tragic 1.4% |
| Immigrants | Jamaica | 0.1 /100 | #310 | Tragic 1.4% |
| Immigrants | Honduras | 0.1 /100 | #311 | Tragic 1.4% |
| Immigrants | Nicaragua | 0.1 /100 | #312 | Tragic 1.4% |
| Menominee | 0.1 /100 | #313 | Tragic 1.4% |
| Dominicans | 0.1 /100 | #314 | Tragic 1.4% |
| Immigrants | Azores | 0.1 /100 | #315 | Tragic 1.4% |
| Navajo | 0.1 /100 | #316 | Tragic 1.4% |
| Immigrants | Micronesia | 0.1 /100 | #317 | Tragic 1.3% |
| Creek | 0.1 /100 | #318 | Tragic 1.3% |
| Immigrants | Guyana | 0.1 /100 | #319 | Tragic 1.3% |
| Immigrants | St. Vincent and the Grenadines | 0.1 /100 | #320 | Tragic 1.3% |