Immigrants from Thailand vs Alaska Native 6th Grade
COMPARE
Immigrants from Thailand
Alaska Native
6th Grade
6th Grade Comparison
Immigrants from Thailand
Alaska Natives
96.3%
6TH GRADE
0.1/ 100
METRIC RATING
278th/ 347
METRIC RANK
98.0%
6TH GRADE
100.0/ 100
METRIC RATING
32nd/ 347
METRIC RANK
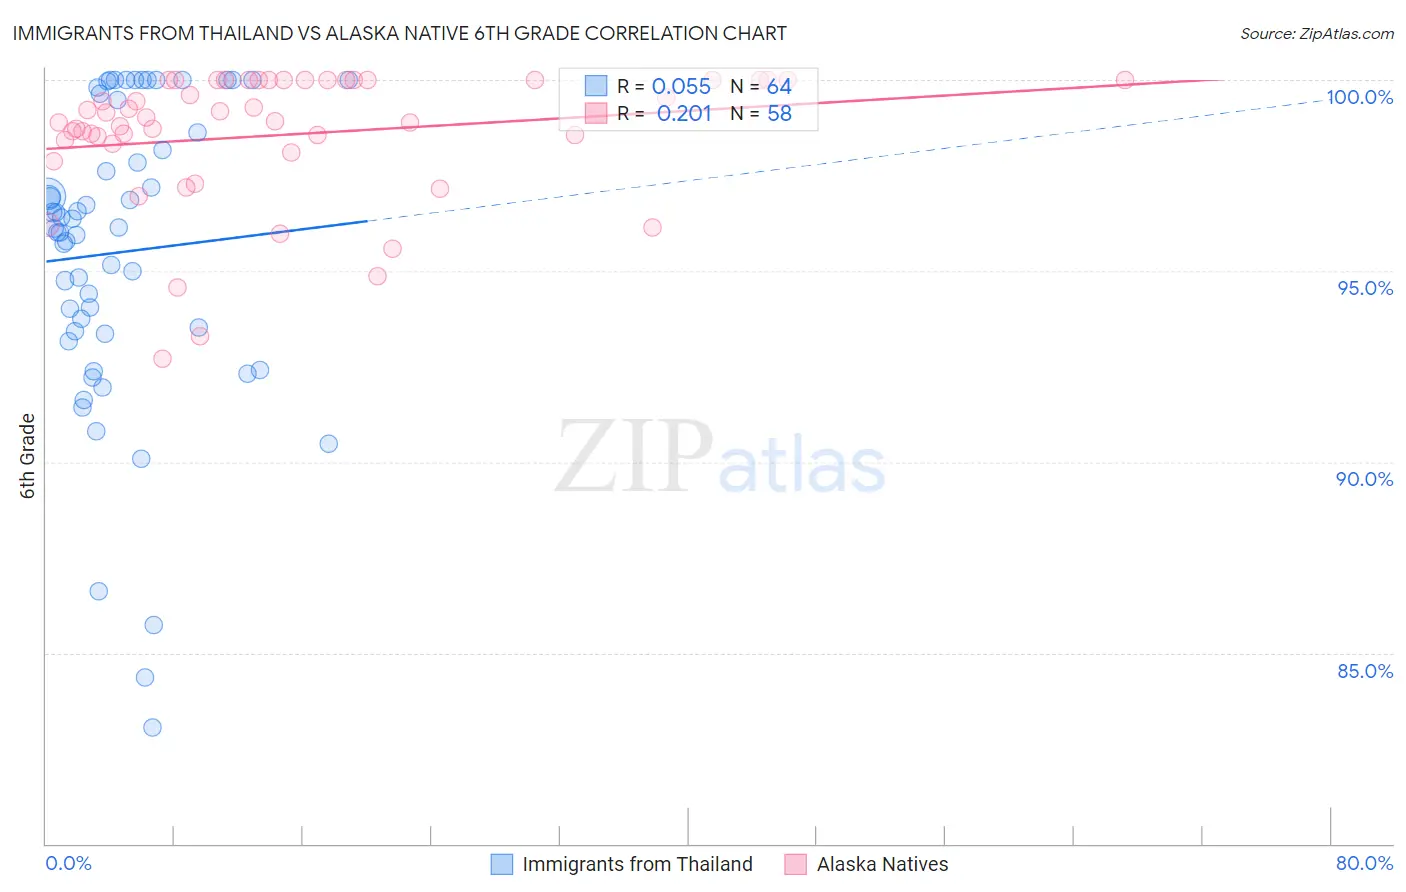
Immigrants from Thailand vs Alaska Native 6th Grade Correlation Chart
The statistical analysis conducted on geographies consisting of 317,022,916 people shows a slight positive correlation between the proportion of Immigrants from Thailand and percentage of population with at least 6th grade education in the United States with a correlation coefficient (R) of 0.055 and weighted average of 96.3%. Similarly, the statistical analysis conducted on geographies consisting of 76,778,057 people shows a weak positive correlation between the proportion of Alaska Natives and percentage of population with at least 6th grade education in the United States with a correlation coefficient (R) of 0.201 and weighted average of 98.0%, a difference of 1.8%.
6th Grade Correlation Summary
| Measurement | Immigrants from Thailand | Alaska Native |
| Minimum | 83.0% | 92.7% |
| Maximum | 100.0% | 100.0% |
| Range | 17.0% | 7.3% |
| Mean | 95.5% | 98.6% |
| Median | 96.1% | 99.0% |
| Interquartile 25% (IQ1) | 93.4% | 98.3% |
| Interquartile 75% (IQ3) | 99.0% | 100.0% |
| Interquartile Range (IQR) | 5.7% | 1.7% |
| Standard Deviation (Sample) | 4.0% | 1.7% |
| Standard Deviation (Population) | 4.0% | 1.7% |
Similar Demographics by 6th Grade
Demographics Similar to Immigrants from Thailand by 6th Grade
In terms of 6th grade, the demographic groups most similar to Immigrants from Thailand are Immigrants from Western Africa (96.3%, a difference of 0.0%), Yaqui (96.3%, a difference of 0.010%), Immigrants from Peru (96.2%, a difference of 0.010%), Immigrants from Ghana (96.3%, a difference of 0.020%), and Immigrants from Afghanistan (96.2%, a difference of 0.020%).
| Demographics | Rating | Rank | 6th Grade |
| Immigrants | Hong Kong | 0.2 /100 | #271 | Tragic 96.3% |
| Immigrants | Bolivia | 0.1 /100 | #272 | Tragic 96.3% |
| Immigrants | Cameroon | 0.1 /100 | #273 | Tragic 96.3% |
| Immigrants | Philippines | 0.1 /100 | #274 | Tragic 96.3% |
| Immigrants | Ghana | 0.1 /100 | #275 | Tragic 96.3% |
| Yaqui | 0.1 /100 | #276 | Tragic 96.3% |
| Immigrants | Western Africa | 0.1 /100 | #277 | Tragic 96.3% |
| Immigrants | Thailand | 0.1 /100 | #278 | Tragic 96.3% |
| Immigrants | Peru | 0.1 /100 | #279 | Tragic 96.2% |
| Immigrants | Afghanistan | 0.1 /100 | #280 | Tragic 96.2% |
| Trinidadians and Tobagonians | 0.1 /100 | #281 | Tragic 96.2% |
| Houma | 0.1 /100 | #282 | Tragic 96.2% |
| Cubans | 0.1 /100 | #283 | Tragic 96.2% |
| Fijians | 0.1 /100 | #284 | Tragic 96.2% |
| Somalis | 0.1 /100 | #285 | Tragic 96.2% |
Demographics Similar to Alaska Natives by 6th Grade
In terms of 6th grade, the demographic groups most similar to Alaska Natives are French Canadian (98.0%, a difference of 0.010%), European (98.0%, a difference of 0.010%), Yup'ik (98.0%, a difference of 0.020%), Scandinavian (98.0%, a difference of 0.020%), and French (98.0%, a difference of 0.020%).
| Demographics | Rating | Rank | 6th Grade |
| Scotch-Irish | 100.0 /100 | #25 | Exceptional 98.0% |
| Czechs | 100.0 /100 | #26 | Exceptional 98.0% |
| Yup'ik | 100.0 /100 | #27 | Exceptional 98.0% |
| Scandinavians | 100.0 /100 | #28 | Exceptional 98.0% |
| French | 100.0 /100 | #29 | Exceptional 98.0% |
| French Canadians | 100.0 /100 | #30 | Exceptional 98.0% |
| Europeans | 100.0 /100 | #31 | Exceptional 98.0% |
| Alaska Natives | 100.0 /100 | #32 | Exceptional 98.0% |
| Chippewa | 100.0 /100 | #33 | Exceptional 97.9% |
| Swiss | 100.0 /100 | #34 | Exceptional 97.9% |
| Chinese | 100.0 /100 | #35 | Exceptional 97.9% |
| Italians | 100.0 /100 | #36 | Exceptional 97.9% |
| British | 100.0 /100 | #37 | Exceptional 97.9% |
| Belgians | 100.0 /100 | #38 | Exceptional 97.9% |
| Luxembourgers | 99.9 /100 | #39 | Exceptional 97.9% |