Peruvian vs Alaska Native 6th Grade
COMPARE
Peruvian
Alaska Native
6th Grade
6th Grade Comparison
Peruvians
Alaska Natives
96.4%
6TH GRADE
0.4/ 100
METRIC RATING
260th/ 347
METRIC RANK
98.0%
6TH GRADE
100.0/ 100
METRIC RATING
32nd/ 347
METRIC RANK
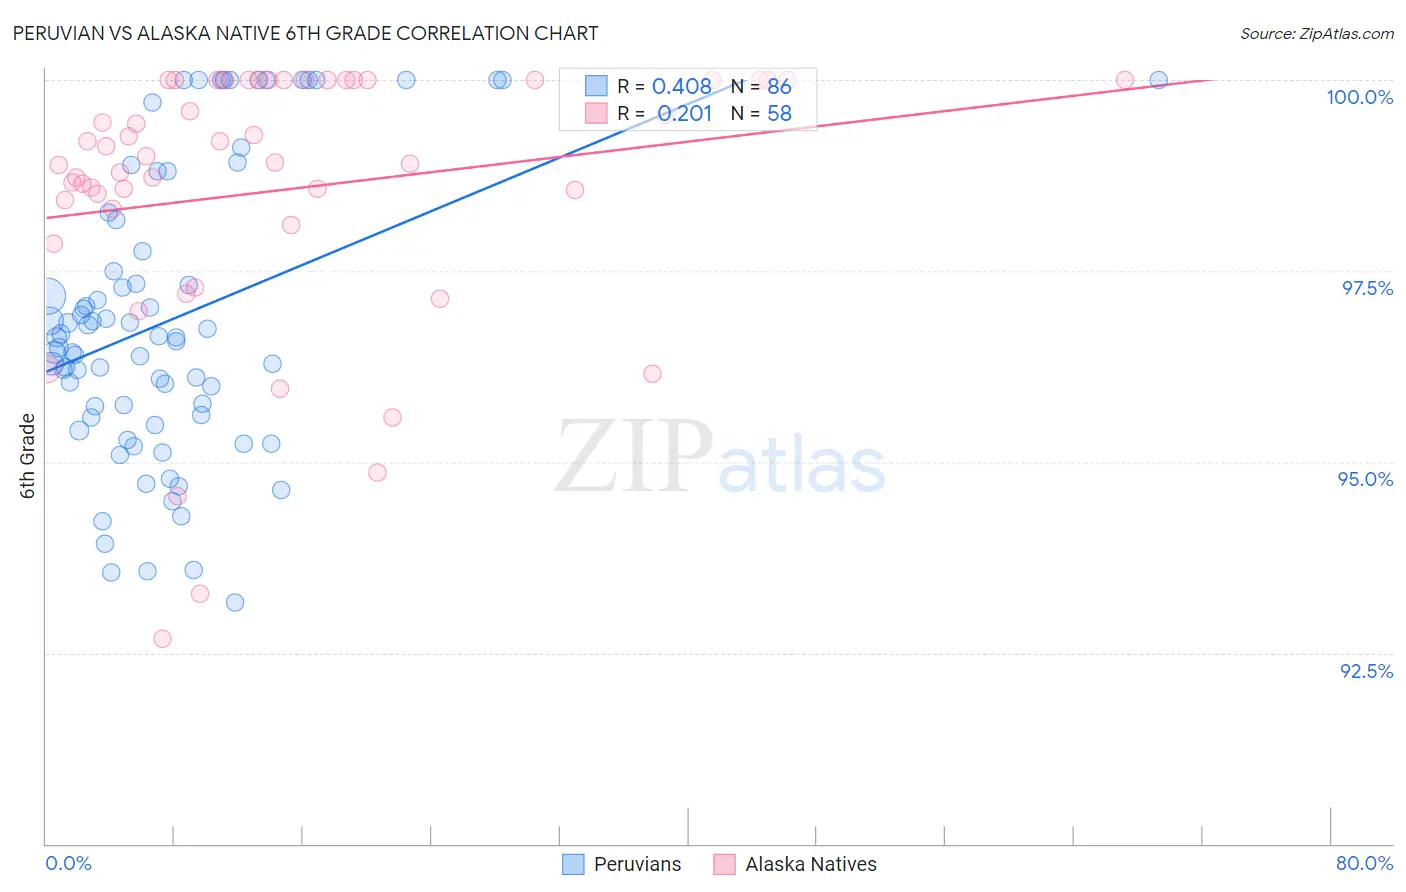
Peruvian vs Alaska Native 6th Grade Correlation Chart
The statistical analysis conducted on geographies consisting of 363,068,462 people shows a moderate positive correlation between the proportion of Peruvians and percentage of population with at least 6th grade education in the United States with a correlation coefficient (R) of 0.408 and weighted average of 96.4%. Similarly, the statistical analysis conducted on geographies consisting of 76,778,057 people shows a weak positive correlation between the proportion of Alaska Natives and percentage of population with at least 6th grade education in the United States with a correlation coefficient (R) of 0.201 and weighted average of 98.0%, a difference of 1.6%.
6th Grade Correlation Summary
| Measurement | Peruvian | Alaska Native |
| Minimum | 93.2% | 92.7% |
| Maximum | 100.0% | 100.0% |
| Range | 6.8% | 7.3% |
| Mean | 96.9% | 98.6% |
| Median | 96.6% | 99.0% |
| Interquartile 25% (IQ1) | 95.6% | 98.3% |
| Interquartile 75% (IQ3) | 98.2% | 100.0% |
| Interquartile Range (IQR) | 2.6% | 1.7% |
| Standard Deviation (Sample) | 1.9% | 1.7% |
| Standard Deviation (Population) | 1.9% | 1.7% |
Similar Demographics by 6th Grade
Demographics Similar to Peruvians by 6th Grade
In terms of 6th grade, the demographic groups most similar to Peruvians are South American (96.4%, a difference of 0.0%), Immigrants from China (96.4%, a difference of 0.010%), Immigrants from Sierra Leone (96.4%, a difference of 0.010%), Taiwanese (96.5%, a difference of 0.020%), and U.S. Virgin Islander (96.5%, a difference of 0.030%).
| Demographics | Rating | Rank | 6th Grade |
| Jamaicans | 0.6 /100 | #253 | Tragic 96.5% |
| Immigrants | Ethiopia | 0.6 /100 | #254 | Tragic 96.5% |
| Immigrants | Congo | 0.6 /100 | #255 | Tragic 96.5% |
| U.S. Virgin Islanders | 0.5 /100 | #256 | Tragic 96.5% |
| Taiwanese | 0.5 /100 | #257 | Tragic 96.5% |
| Immigrants | China | 0.4 /100 | #258 | Tragic 96.4% |
| South Americans | 0.4 /100 | #259 | Tragic 96.4% |
| Peruvians | 0.4 /100 | #260 | Tragic 96.4% |
| Immigrants | Sierra Leone | 0.4 /100 | #261 | Tragic 96.4% |
| Immigrants | Nigeria | 0.3 /100 | #262 | Tragic 96.4% |
| Immigrants | Colombia | 0.3 /100 | #263 | Tragic 96.4% |
| Armenians | 0.3 /100 | #264 | Tragic 96.4% |
| Immigrants | Jamaica | 0.2 /100 | #265 | Tragic 96.4% |
| Ghanaians | 0.2 /100 | #266 | Tragic 96.4% |
| Afghans | 0.2 /100 | #267 | Tragic 96.4% |
Demographics Similar to Alaska Natives by 6th Grade
In terms of 6th grade, the demographic groups most similar to Alaska Natives are French Canadian (98.0%, a difference of 0.010%), European (98.0%, a difference of 0.010%), Yup'ik (98.0%, a difference of 0.020%), Scandinavian (98.0%, a difference of 0.020%), and French (98.0%, a difference of 0.020%).
| Demographics | Rating | Rank | 6th Grade |
| Scotch-Irish | 100.0 /100 | #25 | Exceptional 98.0% |
| Czechs | 100.0 /100 | #26 | Exceptional 98.0% |
| Yup'ik | 100.0 /100 | #27 | Exceptional 98.0% |
| Scandinavians | 100.0 /100 | #28 | Exceptional 98.0% |
| French | 100.0 /100 | #29 | Exceptional 98.0% |
| French Canadians | 100.0 /100 | #30 | Exceptional 98.0% |
| Europeans | 100.0 /100 | #31 | Exceptional 98.0% |
| Alaska Natives | 100.0 /100 | #32 | Exceptional 98.0% |
| Chippewa | 100.0 /100 | #33 | Exceptional 97.9% |
| Swiss | 100.0 /100 | #34 | Exceptional 97.9% |
| Chinese | 100.0 /100 | #35 | Exceptional 97.9% |
| Italians | 100.0 /100 | #36 | Exceptional 97.9% |
| British | 100.0 /100 | #37 | Exceptional 97.9% |
| Belgians | 100.0 /100 | #38 | Exceptional 97.9% |
| Luxembourgers | 99.9 /100 | #39 | Exceptional 97.9% |