Somali vs Bolivian 6th Grade
COMPARE
Somali
Bolivian
6th Grade
6th Grade Comparison
Somalis
Bolivians
96.2%
6TH GRADE
0.1/ 100
METRIC RATING
285th/ 347
METRIC RANK
96.5%
6TH GRADE
1.0/ 100
METRIC RATING
247th/ 347
METRIC RANK
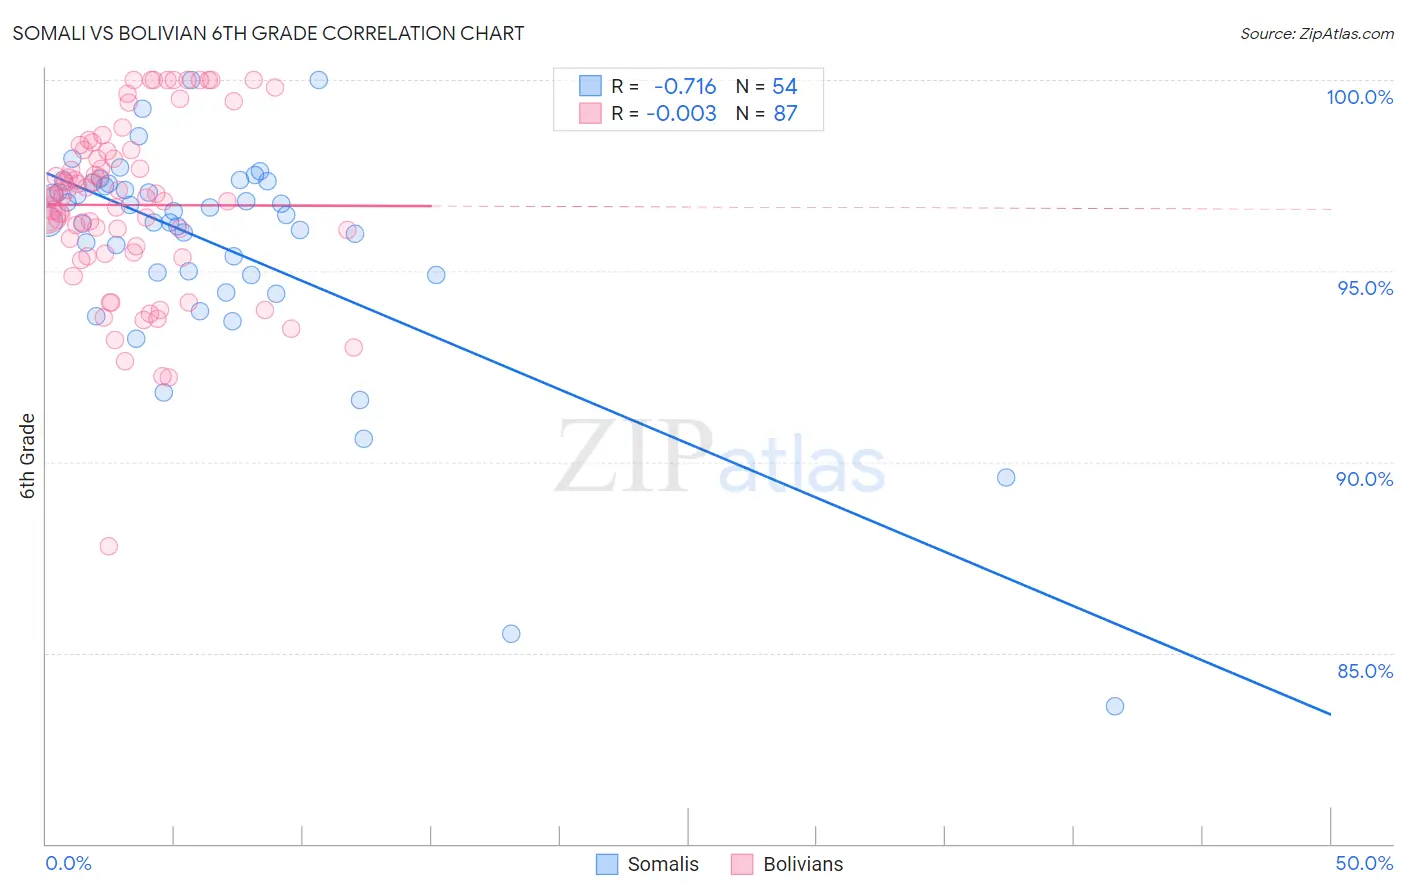
Somali vs Bolivian 6th Grade Correlation Chart
The statistical analysis conducted on geographies consisting of 99,332,457 people shows a strong negative correlation between the proportion of Somalis and percentage of population with at least 6th grade education in the United States with a correlation coefficient (R) of -0.716 and weighted average of 96.2%. Similarly, the statistical analysis conducted on geographies consisting of 184,666,822 people shows no correlation between the proportion of Bolivians and percentage of population with at least 6th grade education in the United States with a correlation coefficient (R) of -0.003 and weighted average of 96.5%, a difference of 0.34%.
6th Grade Correlation Summary
| Measurement | Somali | Bolivian |
| Minimum | 83.6% | 87.8% |
| Maximum | 100.0% | 100.0% |
| Range | 16.4% | 12.2% |
| Mean | 95.6% | 96.7% |
| Median | 96.4% | 96.9% |
| Interquartile 25% (IQ1) | 94.9% | 95.5% |
| Interquartile 75% (IQ3) | 97.3% | 98.2% |
| Interquartile Range (IQR) | 2.4% | 2.7% |
| Standard Deviation (Sample) | 3.0% | 2.3% |
| Standard Deviation (Population) | 3.0% | 2.2% |
Similar Demographics by 6th Grade
Demographics Similar to Somalis by 6th Grade
In terms of 6th grade, the demographic groups most similar to Somalis are Fijian (96.2%, a difference of 0.010%), Cuban (96.2%, a difference of 0.020%), Immigrants from Afghanistan (96.2%, a difference of 0.030%), Trinidadian and Tobagonian (96.2%, a difference of 0.030%), and Houma (96.2%, a difference of 0.030%).
| Demographics | Rating | Rank | 6th Grade |
| Immigrants | Thailand | 0.1 /100 | #278 | Tragic 96.3% |
| Immigrants | Peru | 0.1 /100 | #279 | Tragic 96.2% |
| Immigrants | Afghanistan | 0.1 /100 | #280 | Tragic 96.2% |
| Trinidadians and Tobagonians | 0.1 /100 | #281 | Tragic 96.2% |
| Houma | 0.1 /100 | #282 | Tragic 96.2% |
| Cubans | 0.1 /100 | #283 | Tragic 96.2% |
| Fijians | 0.1 /100 | #284 | Tragic 96.2% |
| Somalis | 0.1 /100 | #285 | Tragic 96.2% |
| Barbadians | 0.0 /100 | #286 | Tragic 96.2% |
| Immigrants | Trinidad and Tobago | 0.0 /100 | #287 | Tragic 96.2% |
| Malaysians | 0.0 /100 | #288 | Tragic 96.2% |
| Immigrants | Eritrea | 0.0 /100 | #289 | Tragic 96.1% |
| Immigrants | Somalia | 0.0 /100 | #290 | Tragic 96.1% |
| Immigrants | St. Vincent and the Grenadines | 0.0 /100 | #291 | Tragic 96.1% |
| Immigrants | Barbados | 0.0 /100 | #292 | Tragic 96.1% |
Demographics Similar to Bolivians by 6th Grade
In terms of 6th grade, the demographic groups most similar to Bolivians are Tohono O'odham (96.5%, a difference of 0.0%), Colombian (96.5%, a difference of 0.010%), Immigrants from Costa Rica (96.6%, a difference of 0.030%), Immigrants from Africa (96.6%, a difference of 0.030%), and Immigrants from Middle Africa (96.5%, a difference of 0.030%).
| Demographics | Rating | Rank | 6th Grade |
| Koreans | 1.9 /100 | #240 | Tragic 96.6% |
| Senegalese | 1.8 /100 | #241 | Tragic 96.6% |
| Immigrants | Asia | 1.8 /100 | #242 | Tragic 96.6% |
| Immigrants | Liberia | 1.6 /100 | #243 | Tragic 96.6% |
| Ethiopians | 1.5 /100 | #244 | Tragic 96.6% |
| Immigrants | Costa Rica | 1.3 /100 | #245 | Tragic 96.6% |
| Immigrants | Africa | 1.3 /100 | #246 | Tragic 96.6% |
| Bolivians | 1.0 /100 | #247 | Tragic 96.5% |
| Tohono O'odham | 1.0 /100 | #248 | Tragic 96.5% |
| Colombians | 0.9 /100 | #249 | Tragic 96.5% |
| Immigrants | Middle Africa | 0.8 /100 | #250 | Tragic 96.5% |
| Immigrants | Senegal | 0.7 /100 | #251 | Tragic 96.5% |
| Immigrants | Uruguay | 0.6 /100 | #252 | Tragic 96.5% |
| Jamaicans | 0.6 /100 | #253 | Tragic 96.5% |
| Immigrants | Ethiopia | 0.6 /100 | #254 | Tragic 96.5% |