Somali vs Dutch West Indian 6th Grade
COMPARE
Somali
Dutch West Indian
6th Grade
6th Grade Comparison
Somalis
Dutch West Indians
96.2%
6TH GRADE
0.1/ 100
METRIC RATING
285th/ 347
METRIC RANK
96.9%
6TH GRADE
28.3/ 100
METRIC RATING
190th/ 347
METRIC RANK
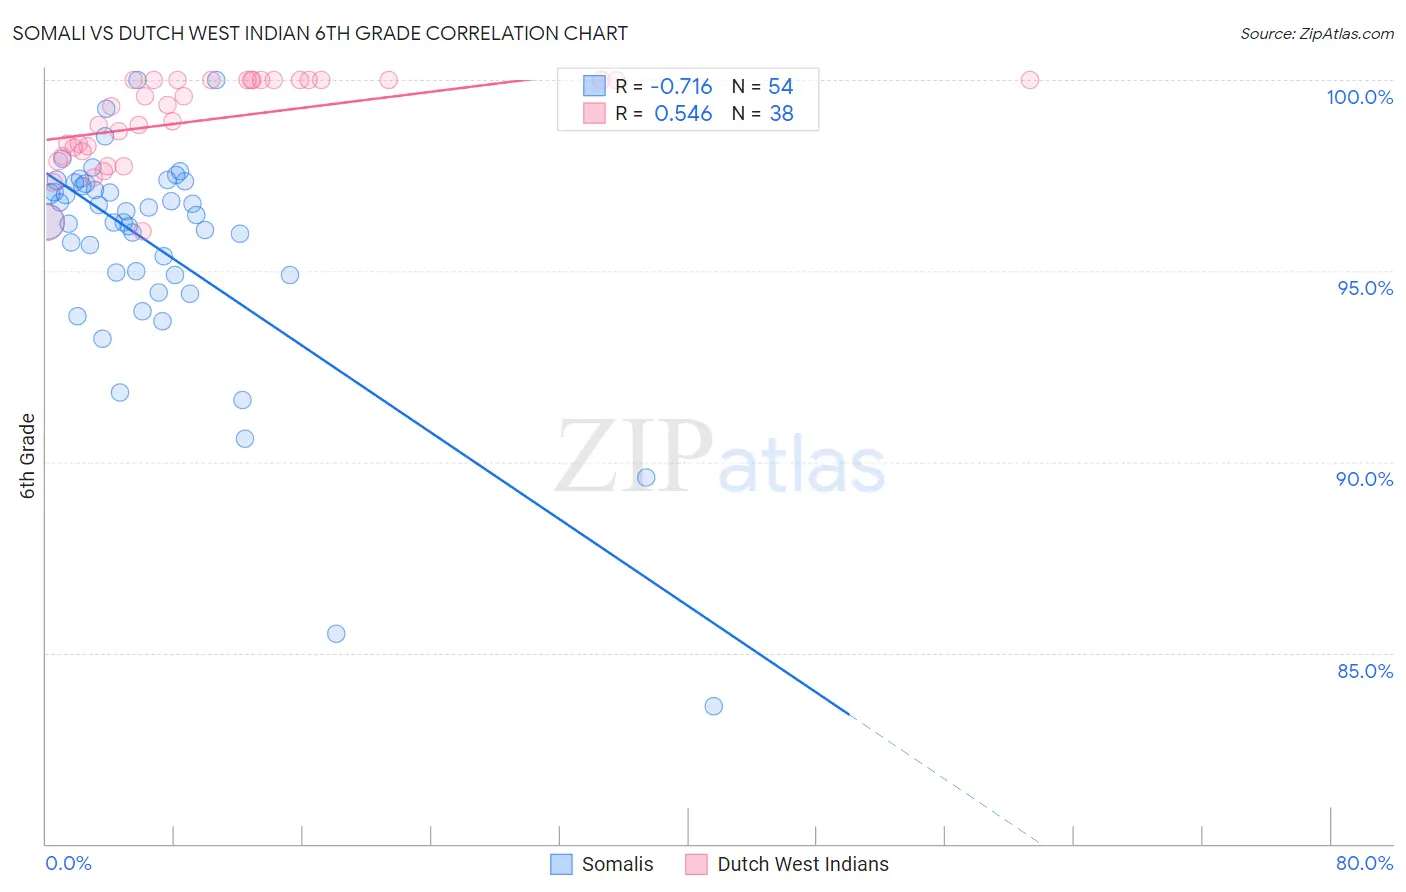
Somali vs Dutch West Indian 6th Grade Correlation Chart
The statistical analysis conducted on geographies consisting of 99,332,457 people shows a strong negative correlation between the proportion of Somalis and percentage of population with at least 6th grade education in the United States with a correlation coefficient (R) of -0.716 and weighted average of 96.2%. Similarly, the statistical analysis conducted on geographies consisting of 85,776,075 people shows a substantial positive correlation between the proportion of Dutch West Indians and percentage of population with at least 6th grade education in the United States with a correlation coefficient (R) of 0.546 and weighted average of 96.9%, a difference of 0.76%.
6th Grade Correlation Summary
| Measurement | Somali | Dutch West Indian |
| Minimum | 83.6% | 96.0% |
| Maximum | 100.0% | 100.0% |
| Range | 16.4% | 4.0% |
| Mean | 95.6% | 99.0% |
| Median | 96.4% | 99.3% |
| Interquartile 25% (IQ1) | 94.9% | 98.1% |
| Interquartile 75% (IQ3) | 97.3% | 100.0% |
| Interquartile Range (IQR) | 2.4% | 1.9% |
| Standard Deviation (Sample) | 3.0% | 1.1% |
| Standard Deviation (Population) | 3.0% | 1.1% |
Similar Demographics by 6th Grade
Demographics Similar to Somalis by 6th Grade
In terms of 6th grade, the demographic groups most similar to Somalis are Fijian (96.2%, a difference of 0.010%), Cuban (96.2%, a difference of 0.020%), Immigrants from Afghanistan (96.2%, a difference of 0.030%), Trinidadian and Tobagonian (96.2%, a difference of 0.030%), and Houma (96.2%, a difference of 0.030%).
| Demographics | Rating | Rank | 6th Grade |
| Immigrants | Thailand | 0.1 /100 | #278 | Tragic 96.3% |
| Immigrants | Peru | 0.1 /100 | #279 | Tragic 96.2% |
| Immigrants | Afghanistan | 0.1 /100 | #280 | Tragic 96.2% |
| Trinidadians and Tobagonians | 0.1 /100 | #281 | Tragic 96.2% |
| Houma | 0.1 /100 | #282 | Tragic 96.2% |
| Cubans | 0.1 /100 | #283 | Tragic 96.2% |
| Fijians | 0.1 /100 | #284 | Tragic 96.2% |
| Somalis | 0.1 /100 | #285 | Tragic 96.2% |
| Barbadians | 0.0 /100 | #286 | Tragic 96.2% |
| Immigrants | Trinidad and Tobago | 0.0 /100 | #287 | Tragic 96.2% |
| Malaysians | 0.0 /100 | #288 | Tragic 96.2% |
| Immigrants | Eritrea | 0.0 /100 | #289 | Tragic 96.1% |
| Immigrants | Somalia | 0.0 /100 | #290 | Tragic 96.1% |
| Immigrants | St. Vincent and the Grenadines | 0.0 /100 | #291 | Tragic 96.1% |
| Immigrants | Barbados | 0.0 /100 | #292 | Tragic 96.1% |
Demographics Similar to Dutch West Indians by 6th Grade
In terms of 6th grade, the demographic groups most similar to Dutch West Indians are Guamanian/Chamorro (97.0%, a difference of 0.010%), Immigrants from Argentina (97.0%, a difference of 0.010%), Black/African American (97.0%, a difference of 0.010%), Panamanian (96.9%, a difference of 0.010%), and Hawaiian (96.9%, a difference of 0.010%).
| Demographics | Rating | Rank | 6th Grade |
| Immigrants | Venezuela | 34.5 /100 | #183 | Fair 97.0% |
| Spanish Americans | 33.5 /100 | #184 | Fair 97.0% |
| Argentineans | 33.0 /100 | #185 | Fair 97.0% |
| Immigrants | Egypt | 31.4 /100 | #186 | Fair 97.0% |
| Guamanians/Chamorros | 30.6 /100 | #187 | Fair 97.0% |
| Immigrants | Argentina | 30.4 /100 | #188 | Fair 97.0% |
| Blacks/African Americans | 30.2 /100 | #189 | Fair 97.0% |
| Dutch West Indians | 28.3 /100 | #190 | Fair 96.9% |
| Panamanians | 27.3 /100 | #191 | Fair 96.9% |
| Hawaiians | 27.0 /100 | #192 | Fair 96.9% |
| Paraguayans | 26.6 /100 | #193 | Fair 96.9% |
| Immigrants | Lebanon | 25.6 /100 | #194 | Fair 96.9% |
| Immigrants | Brazil | 25.5 /100 | #195 | Fair 96.9% |
| Immigrants | Uganda | 21.2 /100 | #196 | Fair 96.9% |
| Brazilians | 20.1 /100 | #197 | Fair 96.9% |