Slovene vs Yugoslavian College, Under 1 year
COMPARE
Slovene
Yugoslavian
College, Under 1 year
College, Under 1 year Comparison
Slovenes
Yugoslavians
67.3%
COLLEGE, UNDER 1 YEAR
93.3/ 100
METRIC RATING
121st/ 347
METRIC RANK
65.6%
COLLEGE, UNDER 1 YEAR
55.7/ 100
METRIC RATING
169th/ 347
METRIC RANK
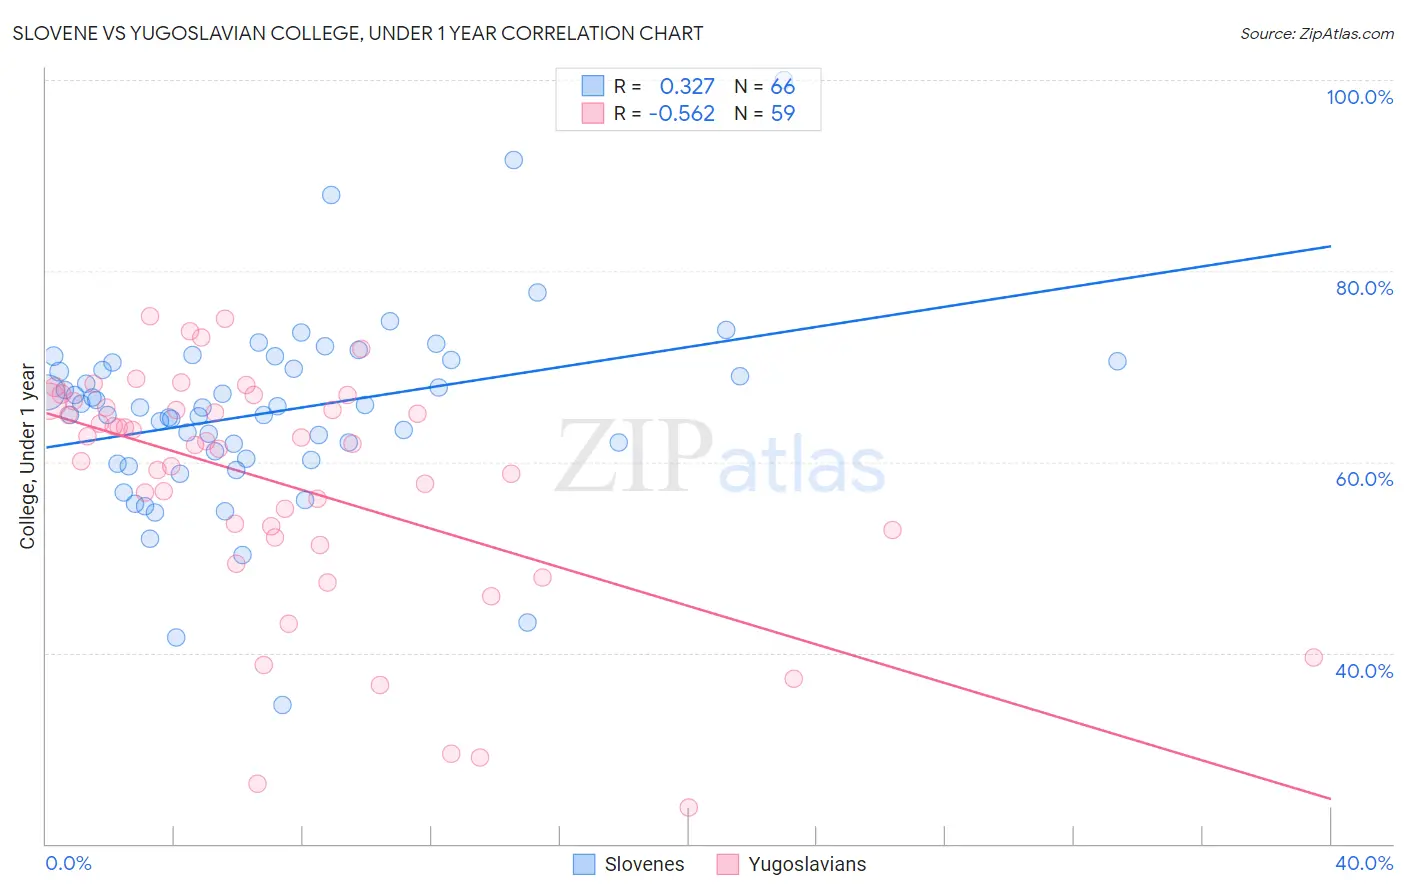
Slovene vs Yugoslavian College, Under 1 year Correlation Chart
The statistical analysis conducted on geographies consisting of 261,353,399 people shows a mild positive correlation between the proportion of Slovenes and percentage of population with at least college, under 1 year education in the United States with a correlation coefficient (R) of 0.327 and weighted average of 67.3%. Similarly, the statistical analysis conducted on geographies consisting of 285,723,201 people shows a substantial negative correlation between the proportion of Yugoslavians and percentage of population with at least college, under 1 year education in the United States with a correlation coefficient (R) of -0.562 and weighted average of 65.6%, a difference of 2.6%.
College, Under 1 year Correlation Summary
| Measurement | Slovene | Yugoslavian |
| Minimum | 34.5% | 23.8% |
| Maximum | 100.0% | 75.2% |
| Range | 65.5% | 51.5% |
| Mean | 65.2% | 57.7% |
| Median | 65.7% | 61.9% |
| Interquartile 25% (IQ1) | 60.3% | 52.1% |
| Interquartile 75% (IQ3) | 70.3% | 66.3% |
| Interquartile Range (IQR) | 10.1% | 14.2% |
| Standard Deviation (Sample) | 10.0% | 12.5% |
| Standard Deviation (Population) | 9.9% | 12.3% |
Similar Demographics by College, Under 1 year
Demographics Similar to Slovenes by College, Under 1 year
In terms of college, under 1 year, the demographic groups most similar to Slovenes are Immigrants from Jordan (67.3%, a difference of 0.090%), Serbian (67.4%, a difference of 0.10%), Immigrants from Northern Africa (67.2%, a difference of 0.11%), Arab (67.2%, a difference of 0.12%), and Lebanese (67.5%, a difference of 0.24%).
| Demographics | Rating | Rank | College, Under 1 year |
| Chileans | 95.3 /100 | #114 | Exceptional 67.6% |
| Basques | 95.2 /100 | #115 | Exceptional 67.6% |
| Immigrants | Nepal | 94.9 /100 | #116 | Exceptional 67.5% |
| Pakistanis | 94.8 /100 | #117 | Exceptional 67.5% |
| Immigrants | Ukraine | 94.7 /100 | #118 | Exceptional 67.5% |
| Lebanese | 94.6 /100 | #119 | Exceptional 67.5% |
| Serbians | 93.9 /100 | #120 | Exceptional 67.4% |
| Slovenes | 93.3 /100 | #121 | Exceptional 67.3% |
| Immigrants | Jordan | 92.8 /100 | #122 | Exceptional 67.3% |
| Immigrants | Northern Africa | 92.7 /100 | #123 | Exceptional 67.2% |
| Arabs | 92.6 /100 | #124 | Exceptional 67.2% |
| Italians | 91.8 /100 | #125 | Exceptional 67.2% |
| Alsatians | 91.3 /100 | #126 | Exceptional 67.1% |
| Czechs | 90.8 /100 | #127 | Exceptional 67.1% |
| Scottish | 90.2 /100 | #128 | Exceptional 67.0% |
Demographics Similar to Yugoslavians by College, Under 1 year
In terms of college, under 1 year, the demographic groups most similar to Yugoslavians are German (65.6%, a difference of 0.0%), Hungarian (65.6%, a difference of 0.010%), Immigrants from Somalia (65.6%, a difference of 0.030%), Immigrants from Oceania (65.6%, a difference of 0.030%), and Moroccan (65.6%, a difference of 0.040%).
| Demographics | Rating | Rank | College, Under 1 year |
| Koreans | 65.3 /100 | #162 | Good 65.9% |
| Somalis | 62.7 /100 | #163 | Good 65.8% |
| Czechoslovakians | 62.6 /100 | #164 | Good 65.8% |
| Immigrants | Uzbekistan | 61.6 /100 | #165 | Good 65.8% |
| Moroccans | 56.7 /100 | #166 | Average 65.6% |
| Immigrants | Somalia | 56.4 /100 | #167 | Average 65.6% |
| Hungarians | 55.9 /100 | #168 | Average 65.6% |
| Yugoslavians | 55.7 /100 | #169 | Average 65.6% |
| Germans | 55.7 /100 | #170 | Average 65.6% |
| Immigrants | Oceania | 55.0 /100 | #171 | Average 65.6% |
| South American Indians | 54.4 /100 | #172 | Average 65.5% |
| Swiss | 53.9 /100 | #173 | Average 65.5% |
| Immigrants | Bosnia and Herzegovina | 50.0 /100 | #174 | Average 65.4% |
| Scotch-Irish | 49.5 /100 | #175 | Average 65.4% |
| French | 48.9 /100 | #176 | Average 65.4% |