Slovene vs Eastern European College, Under 1 year
COMPARE
Slovene
Eastern European
College, Under 1 year
College, Under 1 year Comparison
Slovenes
Eastern Europeans
67.3%
COLLEGE, UNDER 1 YEAR
93.3/ 100
METRIC RATING
121st/ 347
METRIC RANK
71.8%
COLLEGE, UNDER 1 YEAR
100.0/ 100
METRIC RATING
17th/ 347
METRIC RANK
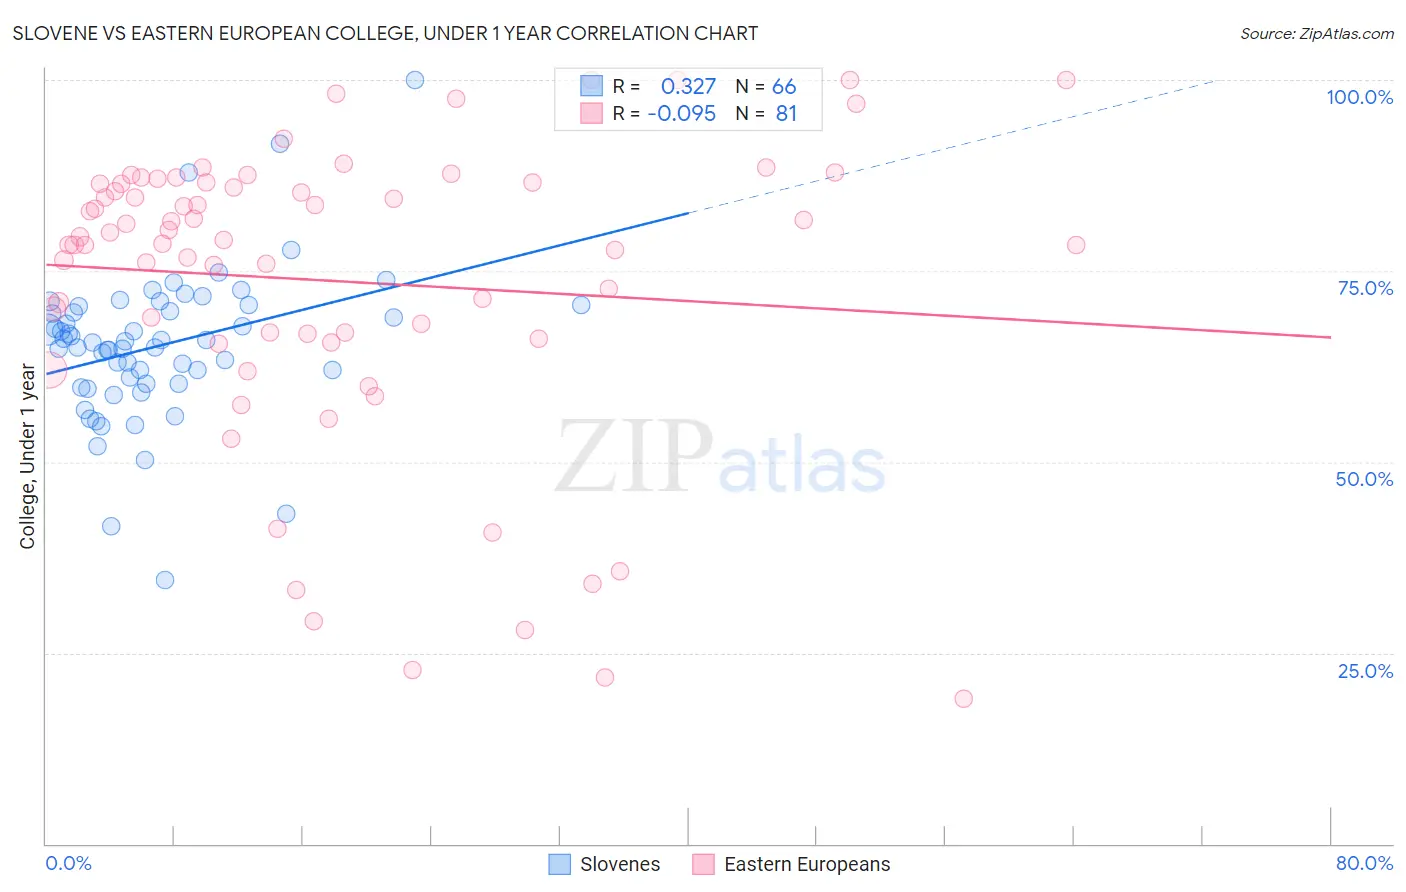
Slovene vs Eastern European College, Under 1 year Correlation Chart
The statistical analysis conducted on geographies consisting of 261,353,399 people shows a mild positive correlation between the proportion of Slovenes and percentage of population with at least college, under 1 year education in the United States with a correlation coefficient (R) of 0.327 and weighted average of 67.3%. Similarly, the statistical analysis conducted on geographies consisting of 461,244,527 people shows a slight negative correlation between the proportion of Eastern Europeans and percentage of population with at least college, under 1 year education in the United States with a correlation coefficient (R) of -0.095 and weighted average of 71.8%, a difference of 6.6%.
College, Under 1 year Correlation Summary
| Measurement | Slovene | Eastern European |
| Minimum | 34.5% | 19.0% |
| Maximum | 100.0% | 100.0% |
| Range | 65.5% | 81.0% |
| Mean | 65.2% | 73.7% |
| Median | 65.7% | 79.0% |
| Interquartile 25% (IQ1) | 60.3% | 66.5% |
| Interquartile 75% (IQ3) | 70.3% | 86.5% |
| Interquartile Range (IQR) | 10.1% | 20.0% |
| Standard Deviation (Sample) | 10.0% | 19.5% |
| Standard Deviation (Population) | 9.9% | 19.4% |
Similar Demographics by College, Under 1 year
Demographics Similar to Slovenes by College, Under 1 year
In terms of college, under 1 year, the demographic groups most similar to Slovenes are Immigrants from Jordan (67.3%, a difference of 0.090%), Serbian (67.4%, a difference of 0.10%), Immigrants from Northern Africa (67.2%, a difference of 0.11%), Arab (67.2%, a difference of 0.12%), and Lebanese (67.5%, a difference of 0.24%).
| Demographics | Rating | Rank | College, Under 1 year |
| Chileans | 95.3 /100 | #114 | Exceptional 67.6% |
| Basques | 95.2 /100 | #115 | Exceptional 67.6% |
| Immigrants | Nepal | 94.9 /100 | #116 | Exceptional 67.5% |
| Pakistanis | 94.8 /100 | #117 | Exceptional 67.5% |
| Immigrants | Ukraine | 94.7 /100 | #118 | Exceptional 67.5% |
| Lebanese | 94.6 /100 | #119 | Exceptional 67.5% |
| Serbians | 93.9 /100 | #120 | Exceptional 67.4% |
| Slovenes | 93.3 /100 | #121 | Exceptional 67.3% |
| Immigrants | Jordan | 92.8 /100 | #122 | Exceptional 67.3% |
| Immigrants | Northern Africa | 92.7 /100 | #123 | Exceptional 67.2% |
| Arabs | 92.6 /100 | #124 | Exceptional 67.2% |
| Italians | 91.8 /100 | #125 | Exceptional 67.2% |
| Alsatians | 91.3 /100 | #126 | Exceptional 67.1% |
| Czechs | 90.8 /100 | #127 | Exceptional 67.1% |
| Scottish | 90.2 /100 | #128 | Exceptional 67.0% |
Demographics Similar to Eastern Europeans by College, Under 1 year
In terms of college, under 1 year, the demographic groups most similar to Eastern Europeans are Immigrants from Switzerland (71.7%, a difference of 0.13%), Immigrants from Japan (71.9%, a difference of 0.14%), Cambodian (71.9%, a difference of 0.16%), Burmese (71.9%, a difference of 0.16%), and Latvian (71.6%, a difference of 0.24%).
| Demographics | Rating | Rank | College, Under 1 year |
| Immigrants | Israel | 100.0 /100 | #10 | Exceptional 72.3% |
| Immigrants | South Central Asia | 100.0 /100 | #11 | Exceptional 72.1% |
| Immigrants | Sweden | 100.0 /100 | #12 | Exceptional 72.1% |
| Cypriots | 100.0 /100 | #13 | Exceptional 72.0% |
| Cambodians | 100.0 /100 | #14 | Exceptional 71.9% |
| Burmese | 100.0 /100 | #15 | Exceptional 71.9% |
| Immigrants | Japan | 100.0 /100 | #16 | Exceptional 71.9% |
| Eastern Europeans | 100.0 /100 | #17 | Exceptional 71.8% |
| Immigrants | Switzerland | 100.0 /100 | #18 | Exceptional 71.7% |
| Latvians | 100.0 /100 | #19 | Exceptional 71.6% |
| Immigrants | Korea | 100.0 /100 | #20 | Exceptional 71.6% |
| Immigrants | Belgium | 100.0 /100 | #21 | Exceptional 71.5% |
| Immigrants | Eastern Asia | 100.0 /100 | #22 | Exceptional 71.3% |
| Immigrants | Northern Europe | 100.0 /100 | #23 | Exceptional 71.1% |
| Soviet Union | 100.0 /100 | #24 | Exceptional 71.1% |